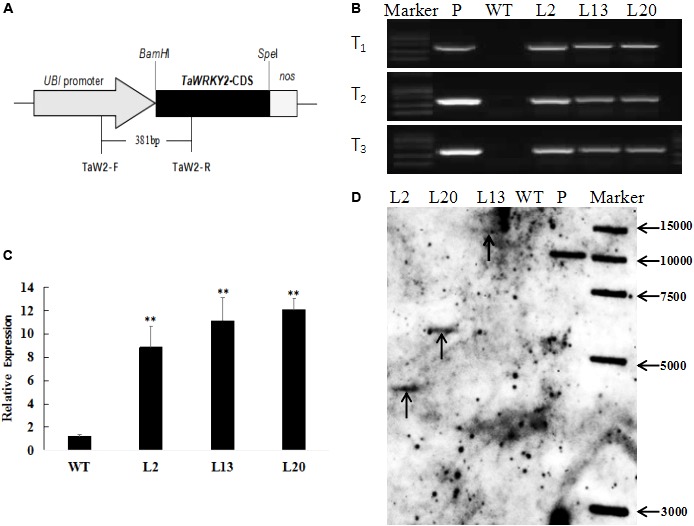
FIGURE 2.

Molecular characterization of transgenic wheat. (A) Schematic diagram of the transformation vector pMWB122-TaWRKY2. (B) PCR analysis of the three transgenic lines from T1 to T3. (C) Relative expression of TaWRKY2 in transgenic wheat. (D) Southern blot analysis of HindIII digested genomic DNAs from untransformed and T3 transgenic plants. WT, wild type; P, plasmid. Asterisks represent statistically significant difference compared WT (Student’s t-test, ∗P < 0.05, ∗∗P < 0.01).
