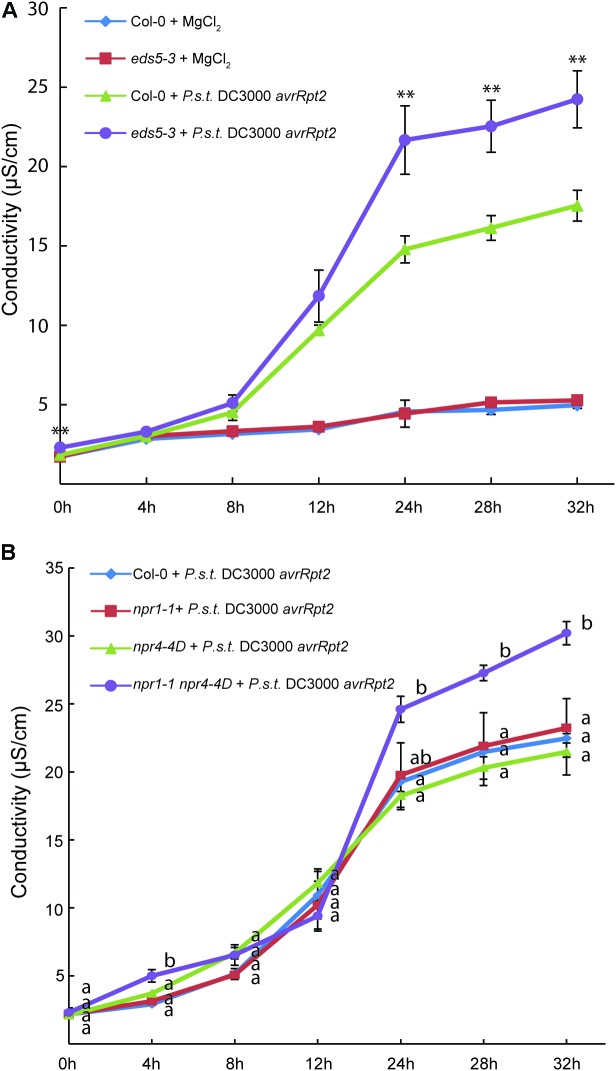
FIGURE 1.
Analysis of ion leakage in eds5-3, npr1-1, npr4-4D, and npr1-1 npr4-4D plants after treatment with P.s.t. DC3000 avrRpt2. Leaves of 4-week-old plants of the indicated genotypes grown under 12 h/12 h light/dark photoperiod at 23°C were infiltrated with mock (10 mM MgCl2) or P.s.t. DC3000 avrRpt2 (OD600 = 0.02). For each plant, two leaves were infiltrated and one leaf disk was cut from each leaf immediately after infiltration. The leaf disks were subsequently washed twice in distilled water. Six leaf disks from three plants, representing one biological replicate, were transferred into a 50-ml plastic tube containing 20 ml of distilled water and electrical conductivity was measured at different time points after infiltration using a VWR EC meter (Model 2052). Each data point on the graph represents the mean ± SD of three biological replicates. In (A), Two-tailed t-test was performed for each time point between wild type (Col-0) and eds5-3 plants treated with P.s.t. DC3000 avrRpt2 (∗∗p < 0.01). In (B), one way ANOVA with post hoc Tukey HSD test was performed for each time point among the different genotypes. Different letters (a,b) indicate statistically significant differences between the samples (p < 0.01).

