
Figure 5.
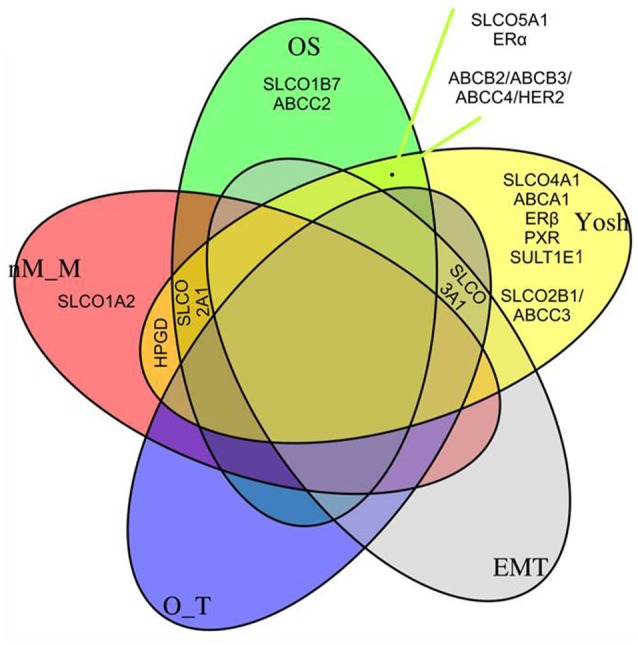
Quintuple Venn plot. Overlapping genes/networks from the LASSO Cox regression model (OS, Figure 2B), a logistic regression model indicating a molecular subclassification system published by Yoshihara et al. (2009), and linear regression models (a gene signature indicating the epithelial-mesenchymal transition status (EMT), a gene signature indicating the putative origin of the tumors (Auer et al., 2017; Sukhbaatar et al., 2017), either ovarian surface epithelium or fallopian tube secretory epithelial cells (O_T), and to a signature indicating either miliary (M) or non-miliary (nM) tumor spread (nM_M) (Auer et al., 2015, 2016, 2017; Bachmayr-Heyda et al., 2016; Sukhbaatar et al., 2017). See also Table 3, where simple Spearman's rank correlation coefficients of all combinations given in Figure are shown.