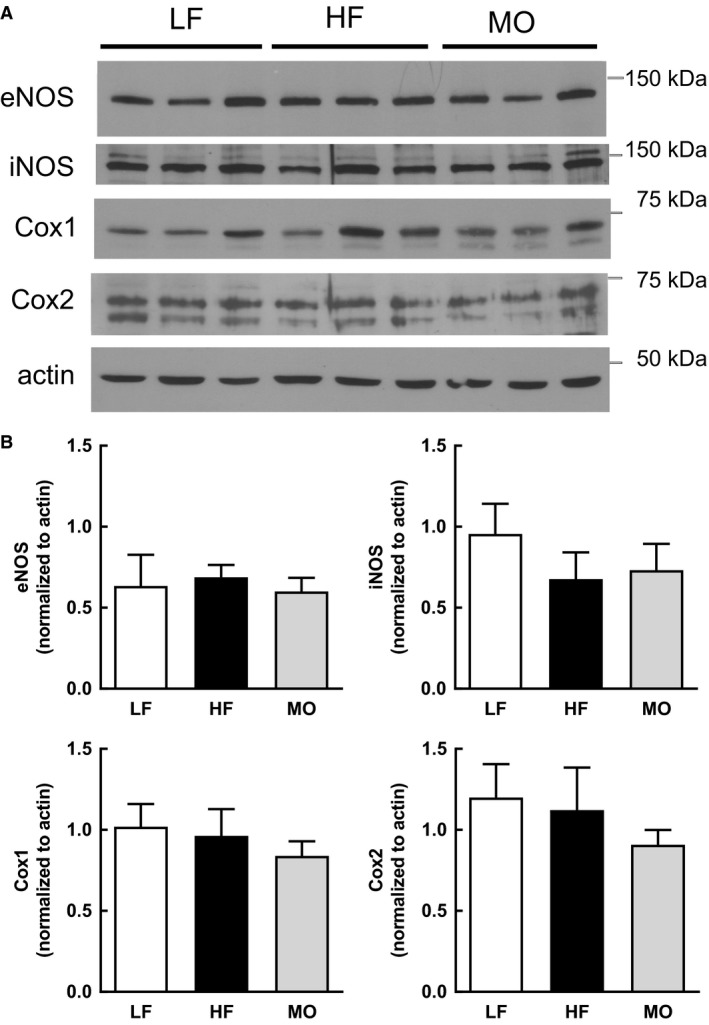
Figure 2.

Fatty acid composition (% of Total) and unsaturation index of aorta from WT and cav‐1 KO mice on LF (WT n = 6, cav‐1 KO n = 4), HF (WT n = 5, cav‐1 KO n = 3) and MO diets (WT n = 6, cav‐1 KO n = 4). Mean ± SEM, *P < 0.05 versus LF and #P < 0.05 versus HF within genotype. ANOVA with Tukey's for multiple comparisons.
