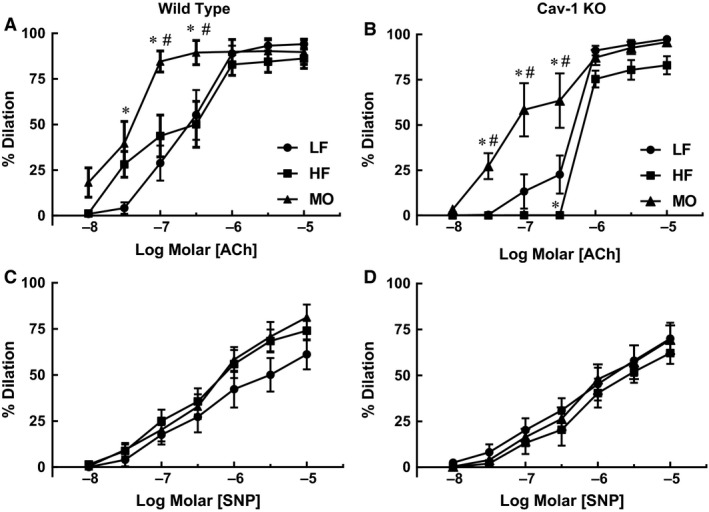
Figure 6.

Responses to acetylcholine (ACh) and nitroprusside (SNP) of gracilis arteries from WT (A. and B. n = 7–11) and cav‐1 KO mice (C. and D. n = 8–9) on LF, HF and MO diets. Mean ± SEM, *P < 0.05 versus LF, #P < 0.05 versus HF. Two‐way ANOVA with Tukey's for multiple comparisons.
