Figure 1.
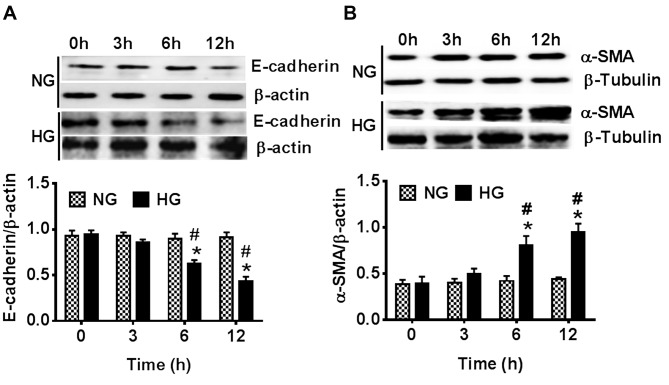
Effects of NG (5.5 mM) and HG (35.5 mM) conditions on the protein expression levels of E-cadherin and α-SMA in human lens epithelial B3 cells at 0 to 12 h. The protein expression levels of (A) E-cadherin and (B) α-SMA were determined using western blot analysis. Data are presented as the mean ± standard deviation. *P<0.05 vs. 0 h in the same group; #P<0.05 vs. NG group at the same time point. NG, normal glucose; HG, high glucose; α-SMA, α-smooth muscle actin.

