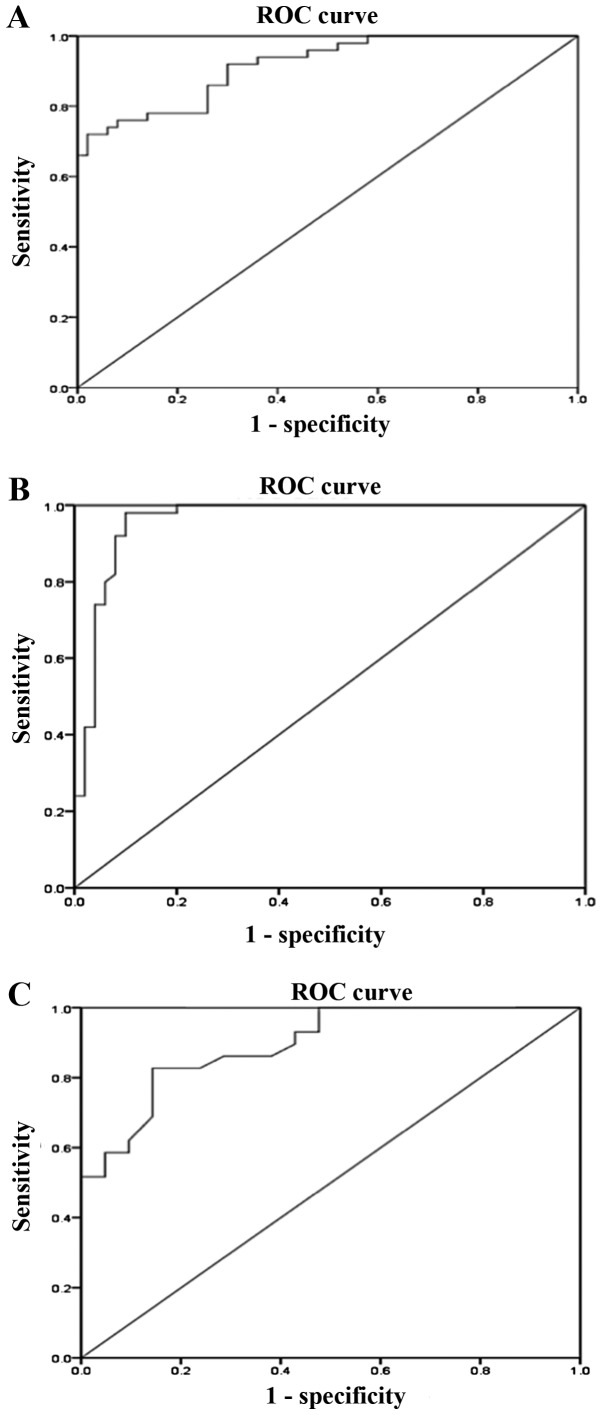
Figure 3.
ROC analysis for mtDNA-CN. ROC curves were generated to evaluate the diagnostic value of peripheral blood mtDNA-CN as a biomarker for DN. (A) The AUC for the differentiation between T2D patients with and without DN based on their mtDNA-CN was 0.92 (95% CI: 0.86-0.97, P<0.01). (B) mtDNA-CN levels were suitable for differentiating between DN patients and healthy controls with an AUC of 0.96 (95% CI: 0.92-1.000, P<0.01). (C) The AUC for the differentiation of T2D patients with DN and microalbuminuria from those with macroalbuminuria based on their mtDNA-CN was 0.895 (95% CI: 0.81-0.98, P<0.01). ROC, receiver operating characteristic; AUC, area under the curve; CI, confidence interval; mtDNA-CN, mitochondrial DNA copy number; DN, diabetic nephropathy; T2D, type 2 diabetes.

