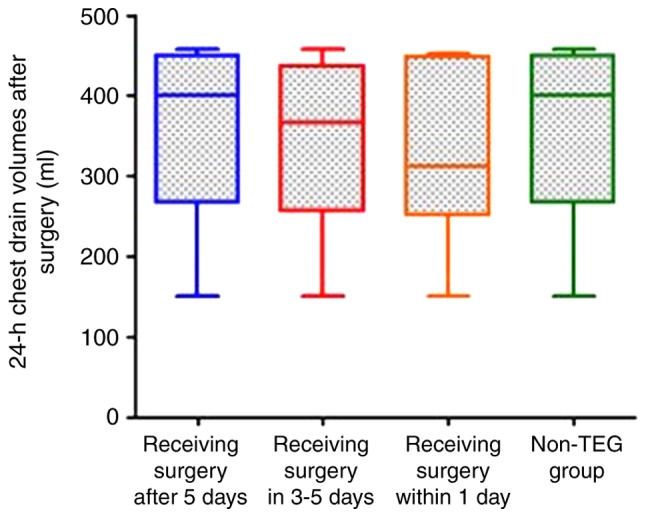
Figure 3.

Box-plot indicating the chest drainage volume of patients in TEG and non-TEG groups. No statistical difference is observed by comparing the chest drains between the two groups (P=0.287). In addition, no statistically significant difference is found in the chest drains of patients of three sub-groups in TEG group were comparable (P=0.532). TEG, thrombelastography.
