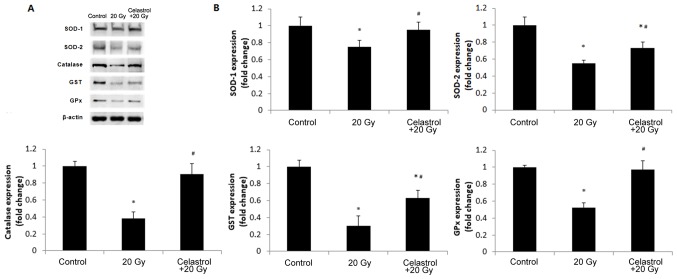
Figure 5.
Effects of treatment with celastrol on the protein expression of antioxidant enzymes. Cells were exposed to 20-Gy γ irradiation, followed by treatment with 1.5 µM celastrol. HUVECs without celastrol treatment and γ radiation served as the control. (A) Representative images of western blot analysis illustrating the intensities of SOD-1, SOD-2, catalase, GST, GPx and β-actin. (B) Densitometric analysis of band intensities of antioxidant enzymes. The image was captured and quantified using the Bio-Rad Gel Doc system. Values were normalized to the respective loading control (β-actin). The results were calculated and expressed as a fold change relative to the control groups. Data are expressed as the mean ± SEM. ANOVA was used to determine statistical significance between groups followed by Tukey's post-hoc test. *P<0.05 vs. control; #P<0.05 vs. 20 Gy without celastrol treatment group. HUVECs, human umbilical vein endothelial cells; SOD, superoxide dismutase; GPx, glutathione peroxidase; GST, glutathione S-transferase; ANOVA, one-way analysis of variance.

