Figure 7.

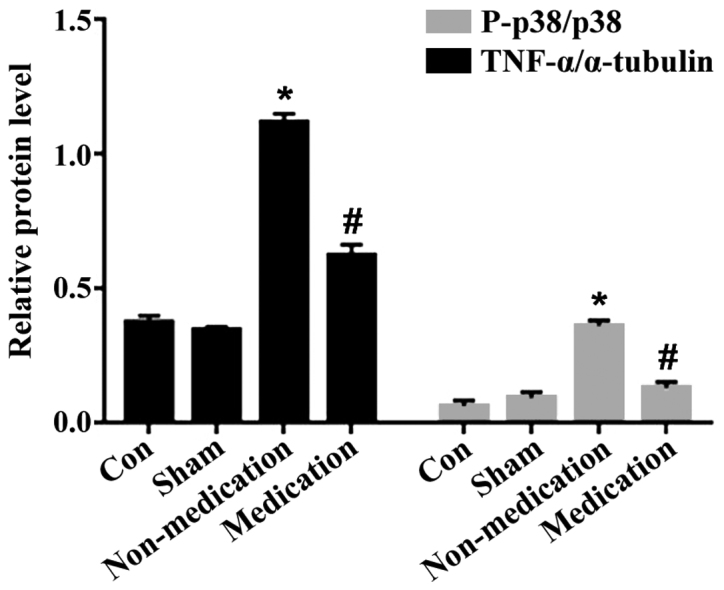
Comparison of protein expression in each group. P-p38, Phosphorylated p38, p38, total p38. *P<0.05, comparison between the non-medication and normal groups. #P<0.05, comparison between the medication and non-medication groups.

Comparison of protein expression in each group. P-p38, Phosphorylated p38, p38, total p38. *P<0.05, comparison between the non-medication and normal groups. #P<0.05, comparison between the medication and non-medication groups.