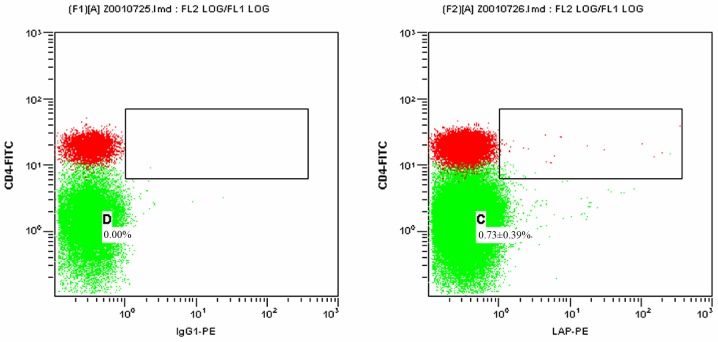
Figure 1.
Proportion of LAP+CD4+ T cells among the PBMCs of the control group detected by flow cytometry. The left and right panels display the results for the isotype control and the experimental sample, respectively. The green dots represent CD4−LAP− T cells and the red dots represent CD4+LAP− T cells. The dots in the upper right box represent LAP+CD4+ T cells. C and D represent the proportion of LAP+CD4+ T cells among the PBMCs in the experimental and isotype control sample, respectively. Percentages represent the proportion of LAP+CD4+ T cells among the PBMCs in different groups presented. PBMCs, peripheral blood mononuclear cells; FITC, fluorescein isothiocyanate; PE, phycoerythrin; LAP, latency-associated peptide; IgG, immunoglobulin.

