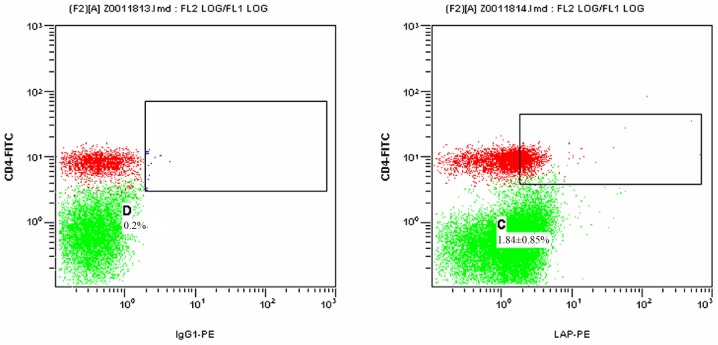
Figure 2.
Proportion of LAP+CD4+ T cells among the PBMCs from the hepatocellular carcinoma group at the pre-operative stage detected by flow cytometry. The left and right panels display the results for the isotype control and the experimental sample, respectively. The green dots represent CD4−LAP− T cells and the red dots represent CD4+LAP− T cells. The dots in the upper right box represent LAP+CD4+ T cells. C and D represent the proportion of LAP+CD4+ T cells among the PBMCs of the experimental and isotype control sample, respectively. Percentages represent the proportion of LAP+CD4+ T cells among the PBMCs in different groups presented. PBMCs, peripheral blood mononuclear cells; FITC, fluorescein isothiocyanate; PE, phycoerythrin; LAP, latency-associated peptide; IgG, immunoglobulin.

