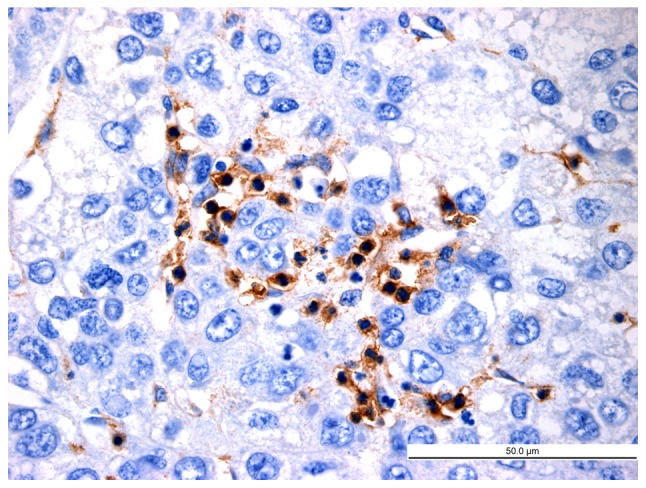
Figure 7.

Distribution of latency-associated peptide+CD4+ T cells in hepatocellular carcinoma tissues (high-power field; magnification, ×400; scale bar, 50 µm).

Distribution of latency-associated peptide+CD4+ T cells in hepatocellular carcinoma tissues (high-power field; magnification, ×400; scale bar, 50 µm).