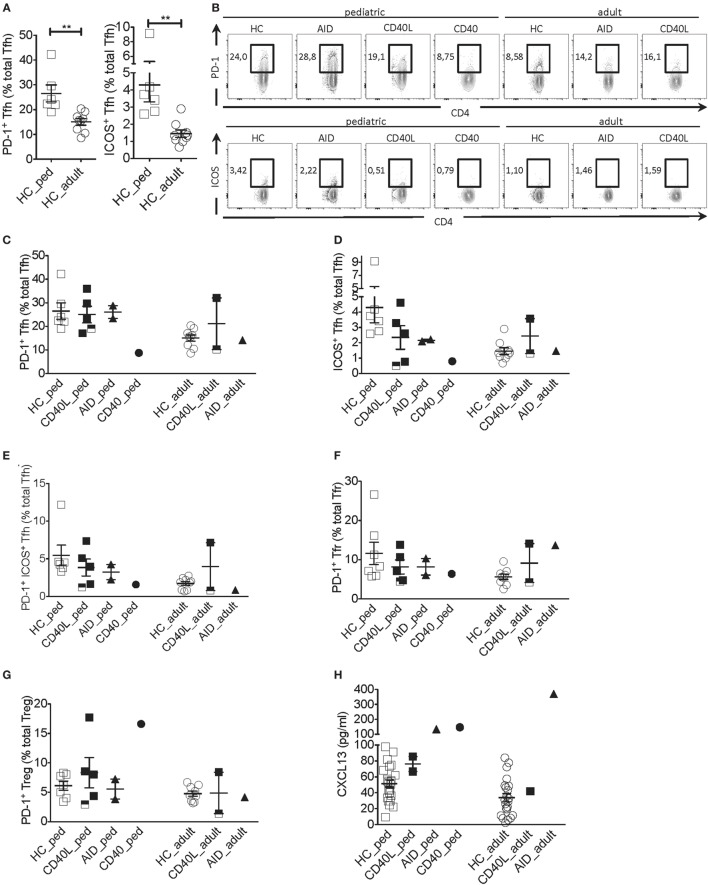
Figure 2.
Tfh cell activation phenotype in a patient with CD40 deficiency compared with patients with CD40L and AICDA mutations. (A) Percentage of PD-1+ and ICOS+ Tfh cells in peripheral blood of a pediatric (HC_ped) and adult (HC_adult) healthy controls (HCs) as described in Figure 1 (gated on singlets → lymphocytes → CD3+CD19−CD14−CD8− → CD4+CD3+ → CD4+CXCR5+). (B) Representative plots for PD-1+ and ICOS+ within Tfh cells in hyper-IgM (HIGM) patients and age-matched HCs. (C,D) Percentage of PD-1+ (C) and ICOS+ (D) Tfh cells in pediatric and adult HIGM patients and age-matched HCs (same as in Figure 1). (E) Percentage of PD-1+ICOS+ Tfh cells in pediatric and adult HIGM patients compared with age-matched HCs. (F,G) The proportion of Tfr (F) and T regulatory (Treg) (G) cells expressing PD-1 in pediatric and adult HIGM patients compared with age-matched HCs. (H) CXCL13 levels in the plasma of pediatric [CD40 ligand (CD40L), n = 2; activation-induced cytidine deaminase (AID), n = 1; CD40, n = 1] and adult HIGM patients (CD40L, n = 1; AID, n = 1) and age-matched HCs (pediatric HC, n = 25, adult HC n = 23). Bars: mean ± SEM. **p < 0.01 (Mann–Whitney test). Each dot represents one patient. Black & white squares represent longitudinal measurements of the same CD40L-deficient patient, collected at 14 and 19 years of age.

