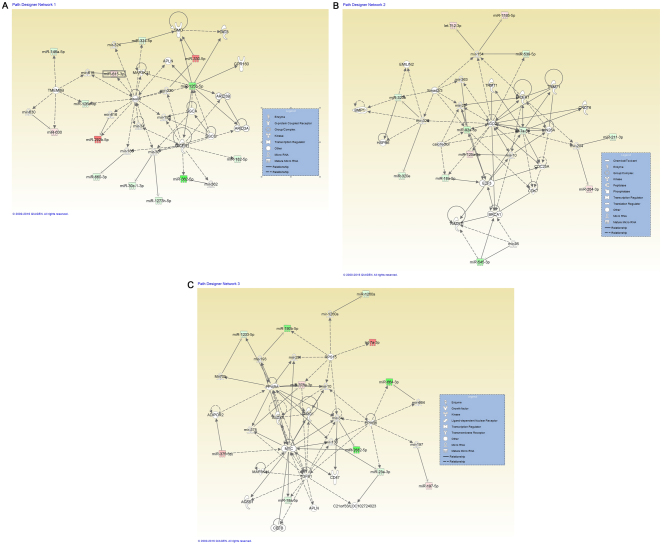
Figure 1.
miRNA-miRNA gene network interactions generated using Ingenuity Pathway Analysis (Qiagen, Inc., Valencia, CA, USA), for miRNAs altered in deuterium-depleted water-maintained DLD-1 cells vs. those maintained in standard conditions. (A) A representative network for organismal injury and abnormalities, reproductive system disease and cancer, containing 13 miRNAs with Dicer1 as a central molecule. (B) Network representative for inflammatory diseases, inflammatory response, and organismal injury and abnormalities, containing 12 miRNAs with Dicer1, Ago2 and E2F3 as key molecules. (C) Network representative for cancer containing 12 miRNAs, hematological diseases and hereditary disorders, with Myc and TGFβ1 as central molecules. miRNAs expression changes are depicted in red (upregulation) and green (downregulation), and the direct target genes that interact with altered miRNAs are grey. miRNA/miR, microRNA; Ago2, Argonaute 2; E2F3, transcription factor E2F3; TGF, transforming growth factor.

