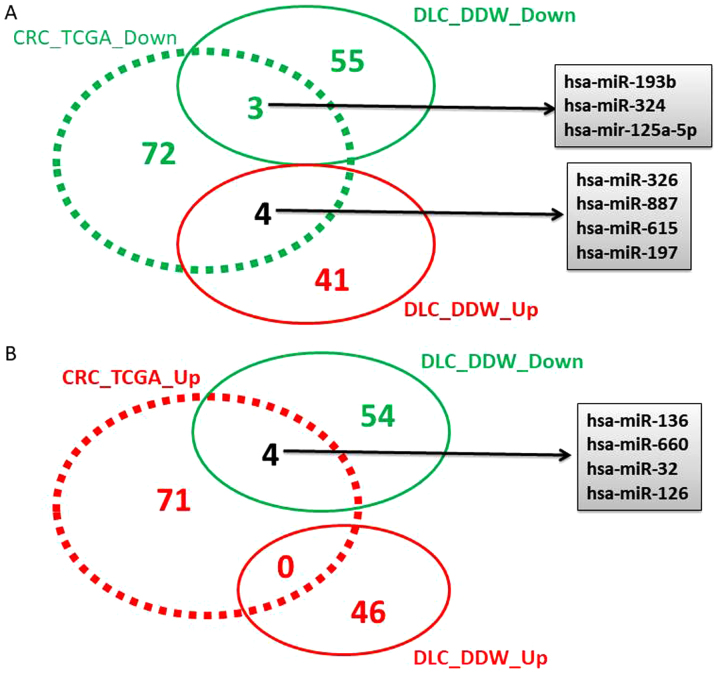
Figure 2.
Venn diagram of (A and B) overexpressed (red) and downregulated (green) has-miRs from The Cancer Genome Atlas data overlapped with the cell culture data. hsa-miR, human microRNA; DOWN, downregulated; UP, upregulated; CRC_TCGA, altered miRNA pattern in the colorectal The Cancer Genome Atlas patient cohort; DLC_DDW, altered miRNA pattern for cells cultured in deuterium-depleted water vs. those maintained in standard conditions.

