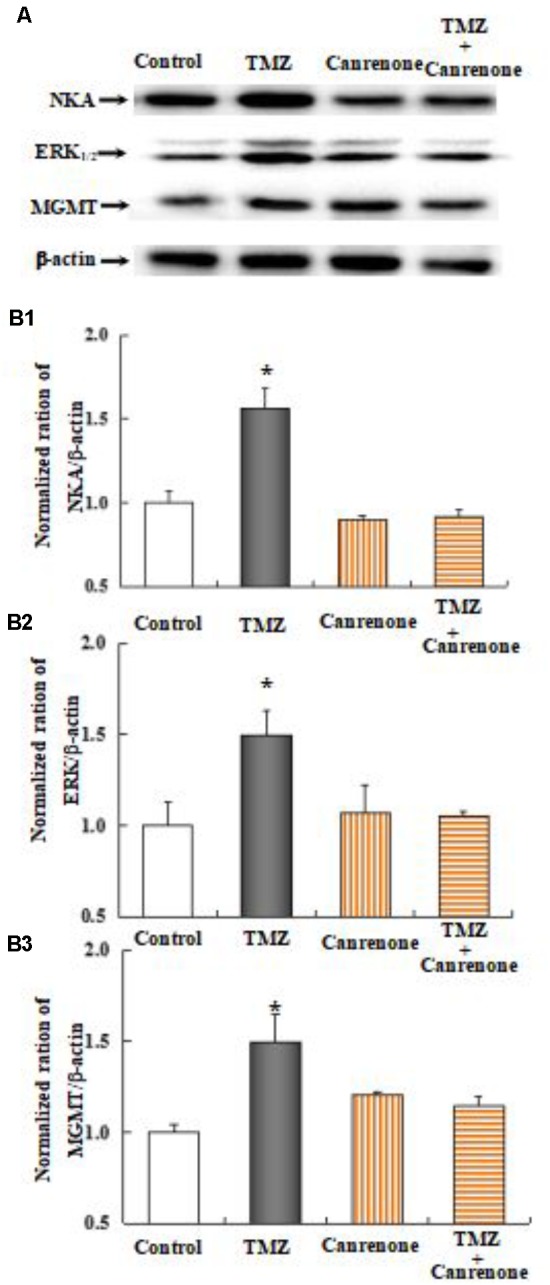
FIGURE 11.

Upregulation of TMZ-induced ERK1/2 and MGMT expression by activation of Na,K-ATPase in U251 cells. (A) Cells were incubated for 48 h in the absence of any drug (Control) or in the presence of 5 μM TMZ. In some experiments 10 μM Canrenone, an inhibitor of Na,K-ATPase, was added 4 h before the addition of TMZ. (B1) Average mean expression was quantified as ratios between Akt and β-actin. (B2) Mean ERK1/2 expression was quantified as ratios between ERK1/2 and β-actin. (B3) Mean MGMT expression was quantified as ratios between MGMT and β-actin. Similar results were obtained from three independent experiments. SEM values are indicated by vertical bars. ∗Indicates a statistically significant (P < 0.05) difference from the negative control group.
