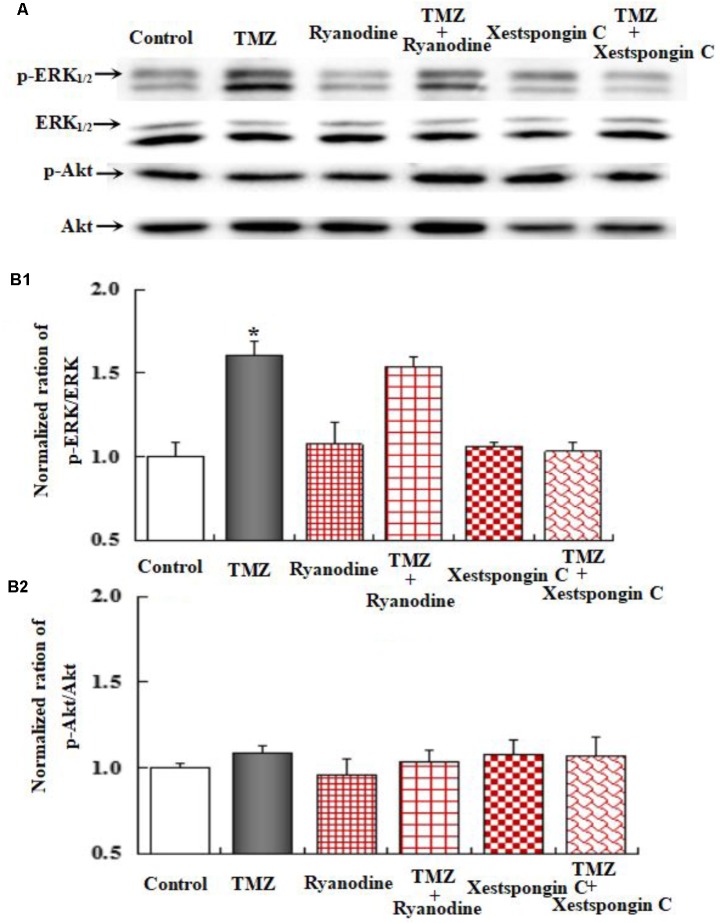
FIGURE 7.
Upregulation of TMZ-induced ERK1/2 phosphorylation by IP3R in U251 cells. (A) Cells were incubated for 20 min in the absence of any drug (Control) or in the presence of 5 μM TMZ. In some experiments, 1 μM Xestspongin C (Xest) and 1 μM Ryanodine (Ryan) were added as in (Figure 6). (B1) Mean ERK phosphorylation was quantified as ratios between p-ERK1/2 and ERK1/2. (B2) Mean Akt phosphorylation was quantified as ratios between p-Akt and Akt. Similar results were obtained from three independent experiments. SEM values are indicated by vertical bars. ∗Indicates a statistically significant (P < 0.05) difference from the negative control group.

