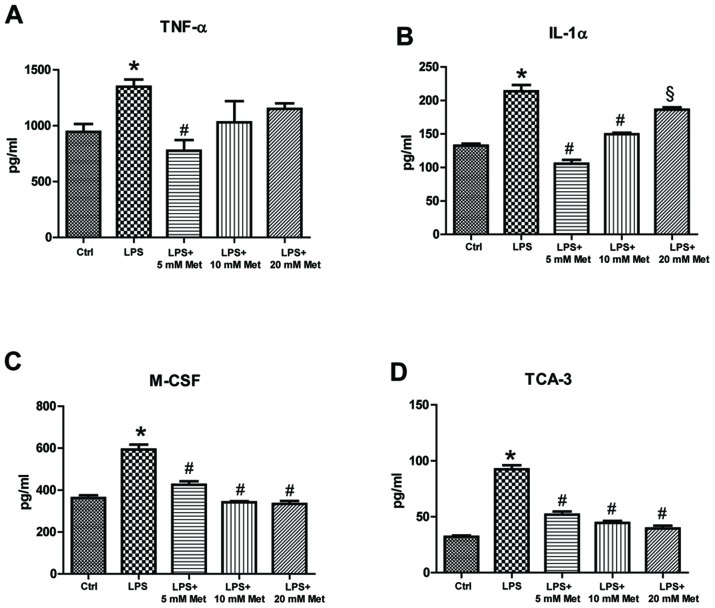
Figure 3.
Effect of metformin treatment on secretion of inflammatory cytokines by mouse CSMCs into the conditioned media, evaluated using ELISA. Levels of (A) TNF-α, (B) IL-1α, (C) M-CSF and (D) TCA-3 in CSMCs following treatment with LPS (1 µg/ml) and varying amounts of metformin (0, 5, 10 and 20 mM). *P<0.01 vs. the Ctrl group; #P<0.01 vs. the LPS group; §P<0.05 vs. the LPS group. LPS, lipopolysaccharide; CSMC, colonic smooth muscle cell; Met, metformin; TNF-α, tumor necrosis factor-α; IL, interleukin; M-CSF, macrophage-colony stimulating factor; TCA-3, T cell activation gene-3; Ctrl, control.

