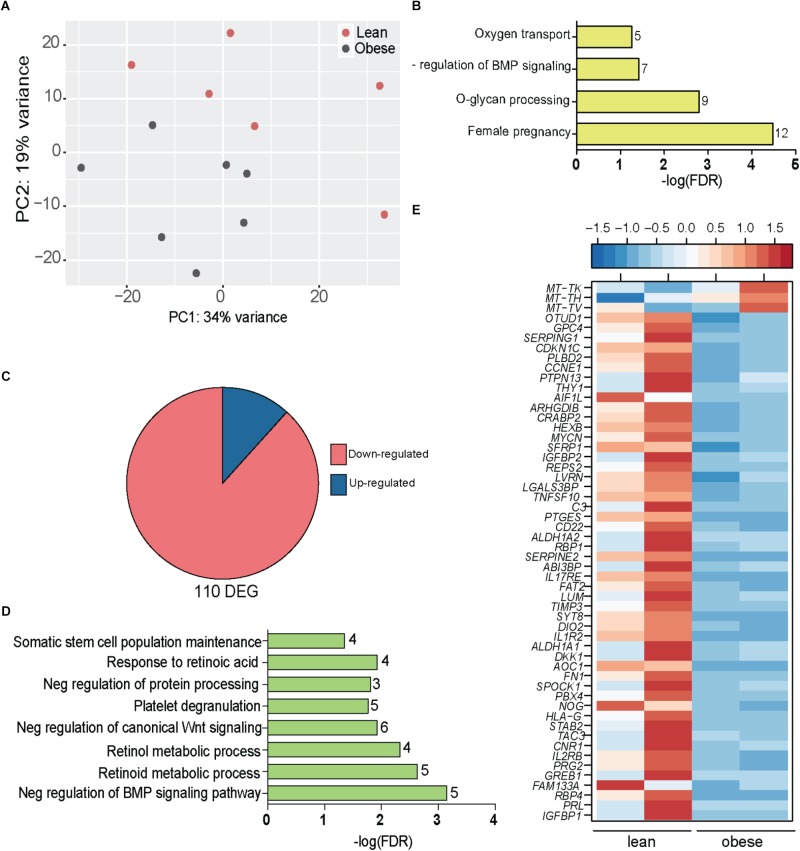
FIGURE 4.
Obesity during pregnancy alters the placental transcriptome. (A) Principal Component Analysis of absolute gene expression of 500 most variable genes. (B) Functional enrichment of the 500 variable genes evaluated using DAVID. Numbers adjacent to the bar represent number of genes mapping to the gene ontology (GO) term. (C) Pie chart denoting number of differentially expressed genes (DEG) identified by edgeR with at least two-fold change in expression and FDR controlled at 5%. (D) Functional enrichment of 110 DEG using DAVID. Numbers adjacent to the bar represent number of DEGs mapping to the GO term (FDR < 5%). (E) Heatmap of genes mapping to disease terms “Immune System Diseases” and “Pregnancy Complications (FDR < 5%) (See Supplementary Figure 4A).

