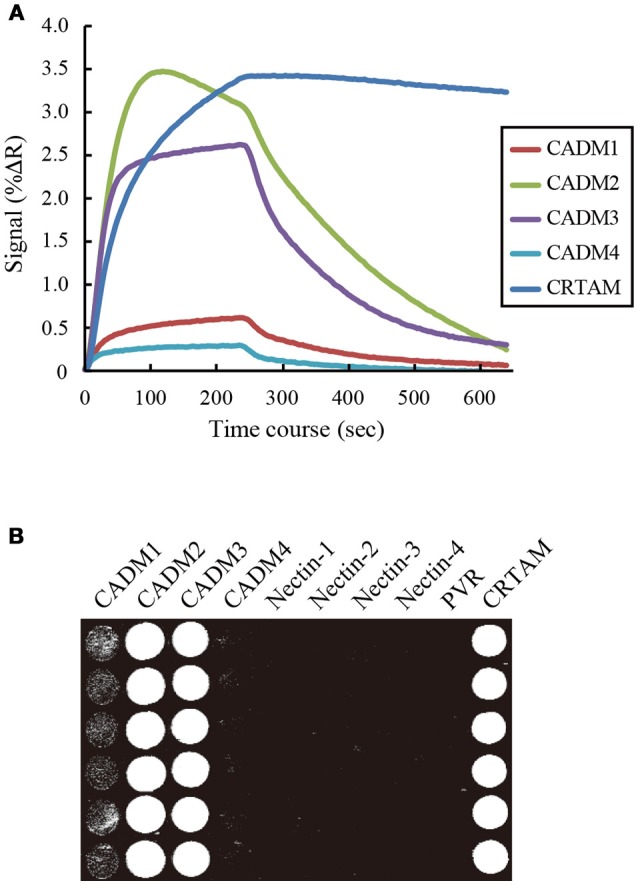
Figure 2.

Surface plasmon resonance imaging analysis of the interactions between CADM1 and its binding partners. (A) SPRi analysis was performed by injecting 2.4 μM CADM1-Fc for 4 min onto the sensor chip where the 10 IgSF-Fc proteins were spotted. The analysis was performed in hexaplicate and the averaged signal of the six spots are shown. Only five molecules giving positive signals are shown. (B) The percent change in reflectivity (%ΔR) at 60 s was visualized as a bright spot on the image.
