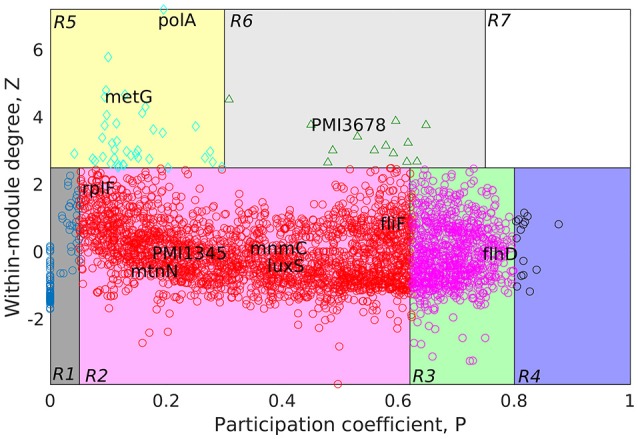
Figure 4.

Cartographic representation for classification of proteins from the GPIN of P. mirabilis based on its role and region in network space. Quadrants are designated as R1 till R7 with the nodes in each representing different classes of proteins. Colors of quadrants, however, have no significance. Selected topmost proteins, with relevance in QS, biofilm and virulence, analyzed from SPIN are mapped onto different quadrants, as deemed fit as per GPIN analysis.
