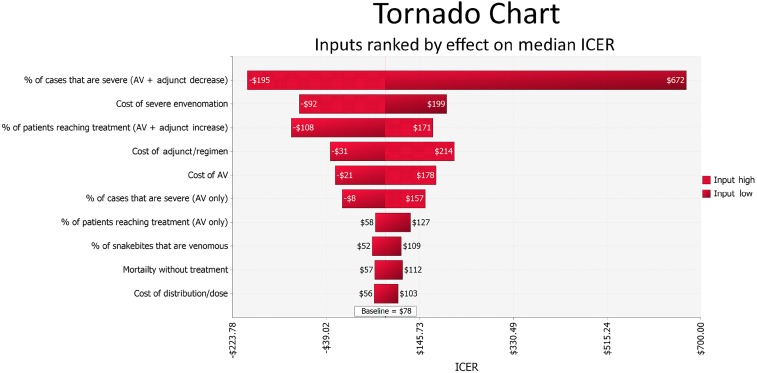
Figure 5.
Tornado chart: the effect of the 10 model parameters that have the greatest effect on the median incremental cost-effectiveness ratios (ICER). Results are based on probabilistic sensitivity analysis with 10,000 iterations. This figure appears in color at www.ajtmh.org.

