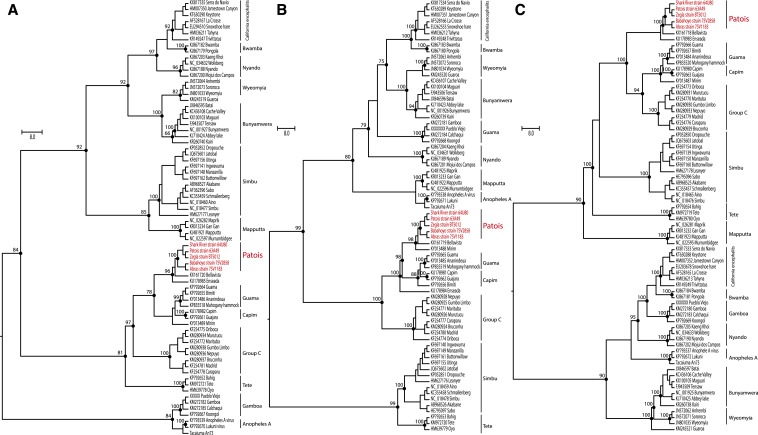
Figure 2.
Maximum likelihood phylogenetic trees of Patois serogroup within Orthobunyavirus genus. The nucleoprotein (A), glycoprotein (B), and RdRP (C), all based on LG + I + G4 model amino acids substitution model. Phylogenies are midpoint rooted and with proportional branches for clarity of presentation. The scale bar indicates evolutionary distance in numbers of substitutions per amino acid substitutions/site, and the principal bootstrap support levels were indicated. The Patois virus strains sequenced in this study are highlighted in light grey and in red (online). This figure appears in color at www.ajtmh.org.

