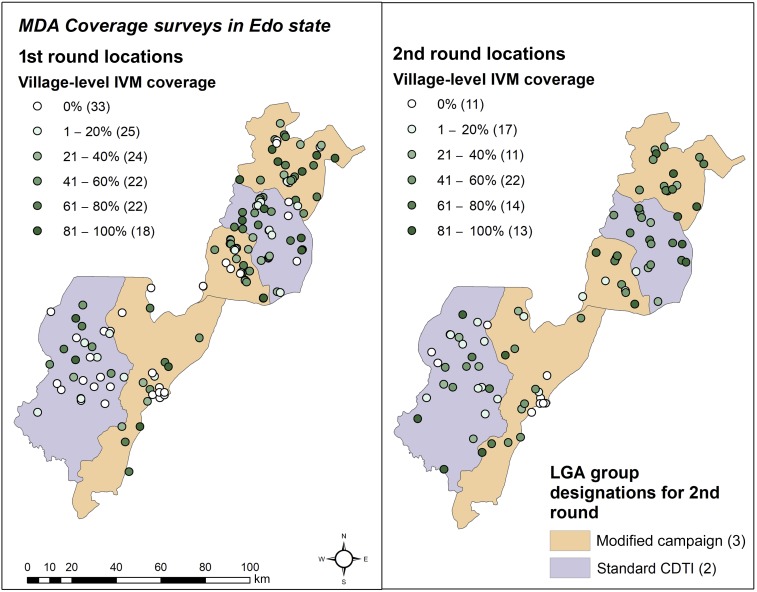
Figure 2.
Geographic distribution and allocation of EAs in different categories of treatment coverage. Global positioning system coordinates were not available for one EA in the first round. Group designations apply to the second round only but are shown in the first for comparison. Note that the plurality of villages was not treated in the first round, whereas in the second 41–60% was the most common level of coverage. EA = enumeration area. This figure appears in color at www.ajtmh.org.

