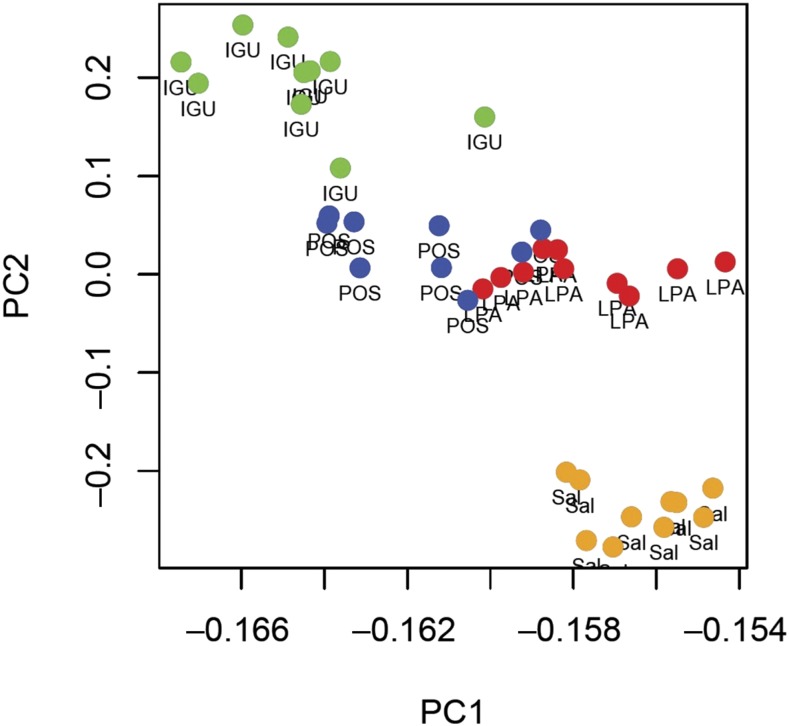
Figure 5.
Two-dimensional representation of the Argentine Aedes aegypti genetic variability using PC1 and PC2. Each dot represents an individual mosquito from each of the populations: IGU = Iguazu; LPA = La Plata; POS = Posada; SAL = Salta. This figure appears in color at www.ajtmh.org.

