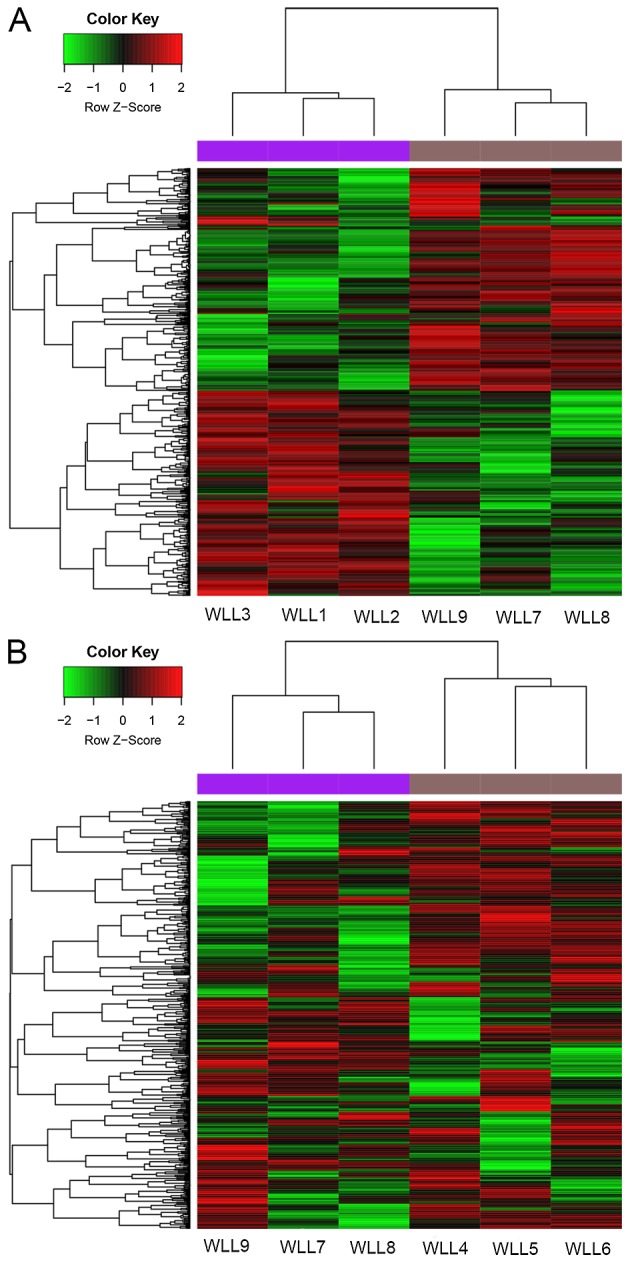
Figure 1.

Heat maps of the DEGs. (A) Heat map of DEGs between the severe pneumonia alone group and the control group. (B) Heat map of DEGs between the severe pneumonia with COPD group and the control group. Green indicates downregulated and red indicates upregulated. DEGs, differentially expressed genes; COPD, chronic obstructive pulmonary disease. WLL1-3, samples taken from patients with severe pneumonia alone; WLL4-6, samples taken from severe pneumonia patients accompanied with COPD; WLL7-9, samples taken from the normal controls.
