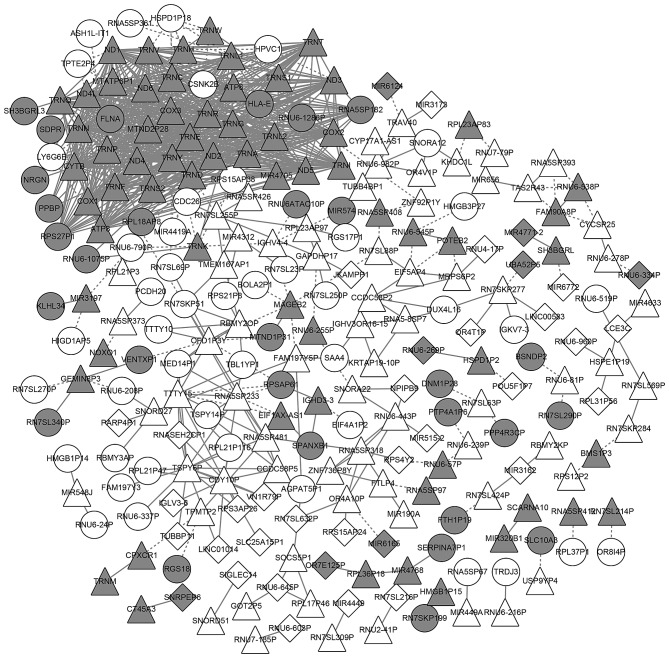
Figure 3.
Coexpression network of the differentially expressed genes. White nodes represent the upregulated genes and grey nodes represent the downregulated genes. Round nodes represent the genes that are differentially expressed only in the patients with severe pneumonia alone. Quadrate nodes represent the genes that are differentially expressed only in the severe pneumonia patients with chronic obstructive pulmonary disease. Triangular nodes represent the genes that are differentially expressed in both patients with severe pneumonia alone and severe pneumonia patients with chronic obstructive pulmonary disease. The solid line represents the positive correlation, namely, the Pearson correlation coefficient >0; the dotted line represents the negative correlation, namely, the Pearson correlation coefficient <0.

