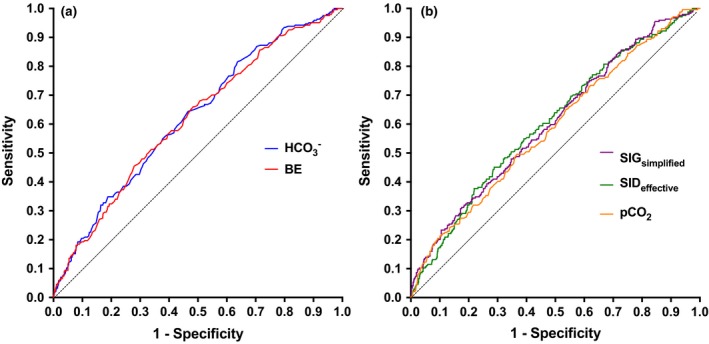
Figure 1.

(a) Receiver operating characteristic (ROC) curves for mortality prediction based on bicarbonate and base excess, (b) ROC curves for mortality prediction based on SIG simplified and SID effective and pCO 2. Individual area under the ROC curve (AUROC) values were: bicarbonate (AUROC 0.622, P < 0.0001), base excess (AUROC 0.616, P < 0.0001), SID effective (AUROC 0.604, P < 0.0001), SIG simplified (AUROC 0.603, P < 0.0001), and pCO 2 (AUROC 0.585, P < 0.0001). SID, strong ion difference; SIG, strong ion gap.
