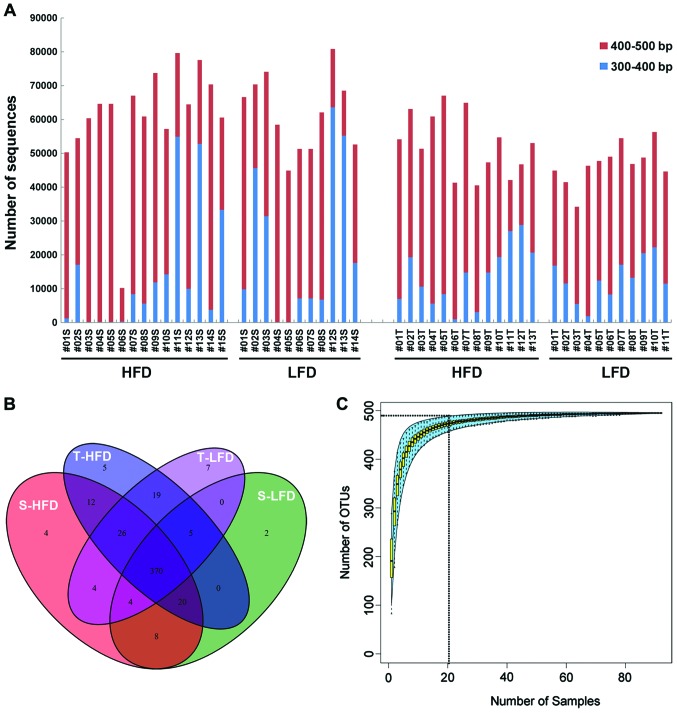
Figure 1.
Analysis of sequences and OTU distribution in each of the 26 stool samples and the 24 colonic mucosal tissue samples. (A) The number of sequences at two intervals of 300–400 bp and 400–500 bp in each sample. (B) Venn diagram of OTUs defined at 97% similarity level. Red indicating stool samples of high-fat diet group (abbreviated as S-HFD); green stool samples of low-fat diet group (S-LFD); blue colon mucosa tissue samples of high-fat diet group (T-HFD) and purple colon mucosa tissue samples of low-fat diet group (T-LFD). (C) Species accumulation curve. OTU, operational taxonomic unit; HDF, high-fat diet; LFD, low-fat diet.

