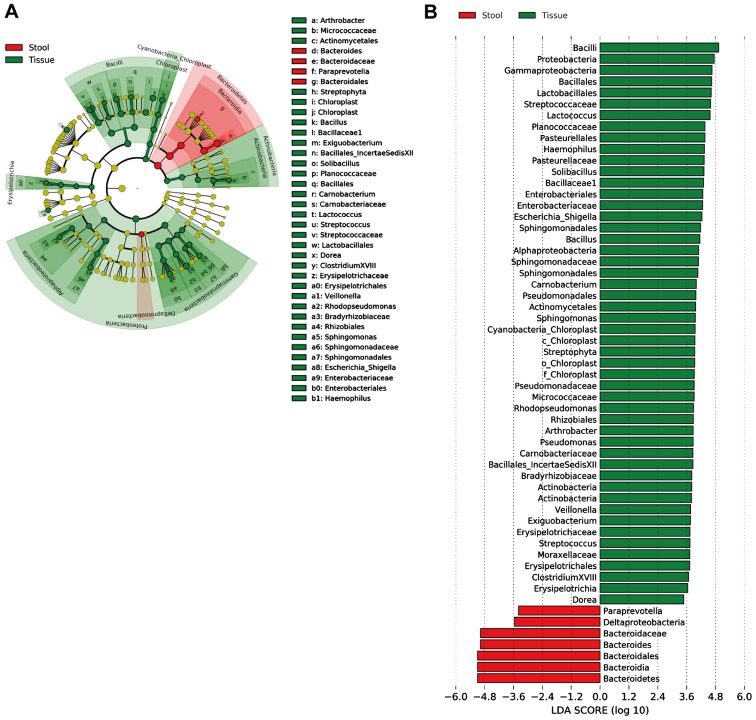
Figure 4.
Different structures of microbiota between stool and colon mucosa tissue. (A) Taxonomic representation of statistically and biologically consistent differences between stool and colonic mucosal tissue. Differences are represented by the color of the most abundant class (red indicating stool, green representing colonic mucosal tissue and yellow meaning non-significant). Each circle's diameter is proportional to the taxon's abundance. (B) Histogram of the LDA scores for differential abundance. Cladogram was calculated by LEfSe, and displayed according to effect size.

