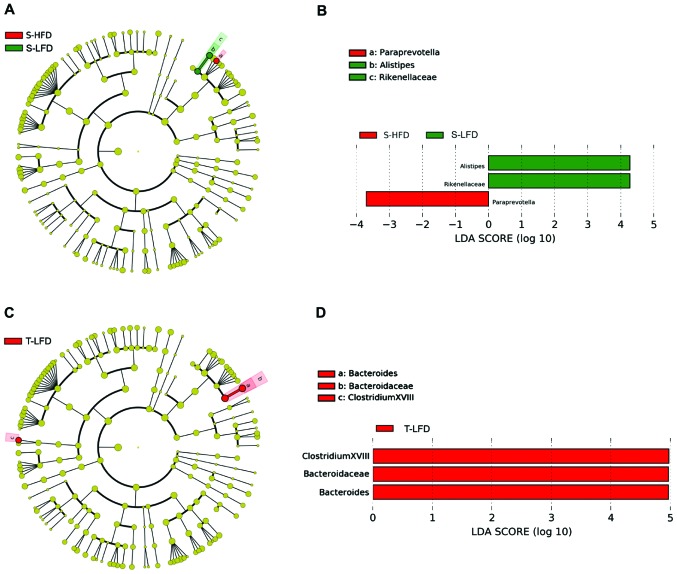
Figure 5.
Different structures of stool and colon mucosa tissue microbiota between HFD and LFD groups. (A and C) Taxonomic representation of statistical differences in stool and colonic mucosa between the two groups. (B and D) Histogram of the LDA scores for differentially abundance of taxon. HDF, high-fat diet; LFD, low-fat diet; LDA, linear discriminant analysis.

