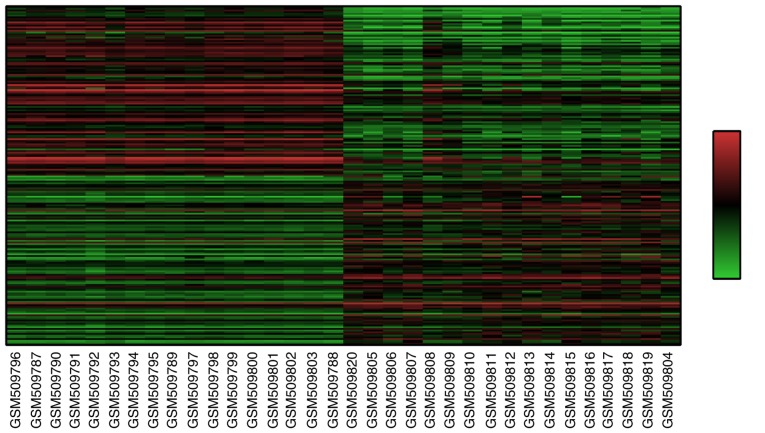
Figure 1.
Heat map of the top 200 differentially expressed genes (100 upregulated and 100 downregulated genes). GSM509796 to GSM509788: Normal tissue of patients with esophageal squamous-cell carcinoma; GSM509820 to GSM509804: Tumor tissue of patients with esophageal squamous-cell carcinoma. Red indicates high expression levels and green low expression levels.

