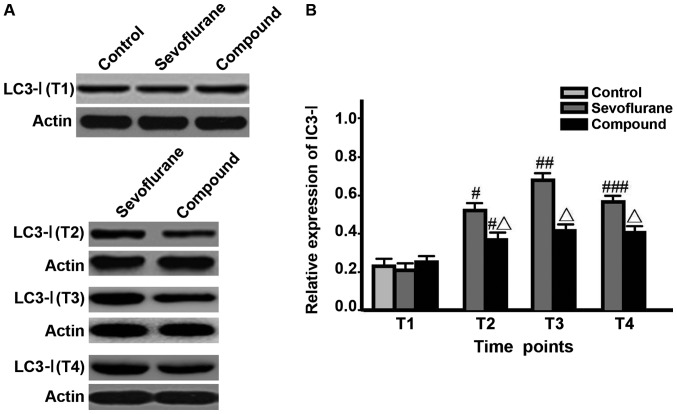
Figure 1.
Detection of the LC3-I expression levels at different time points via western blotting (#P<0.05, comparisons of sevoflurane group and compound group at T2 with the same groups at T1; ##P<0.05, comparison between sevoflurane group at T3 and the same group at T2; ###P<0.05, comparison between sevoflurane group at T4 and the same group at T3; △P<0.05, comparisons between compound group at T2-T4 and sevoflurane group in the same time).

