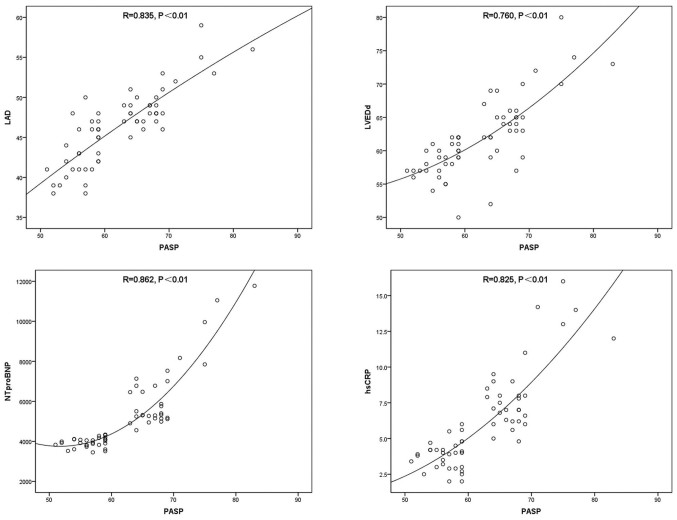
Figure 1.
Scatter plots for the correlations between PASP+LAD (R=0.835, P<0.01), PASP+LVEDd (R=0.760, P<0.01), PASP+NT-proBNP (R=0.862, P<0.01) and PASP+hsCRP (R=0.825, P<0.01) prior to therapy. PASP, pulmonary artery systolic pressure; LAD, left atrial diameter; LVEDd, left ventricle end diastolic diameter; NT-proBNP, N-terminal pro-B-type natriuretic peptide; hsCRP, hypersensitive C-reactive protein.

