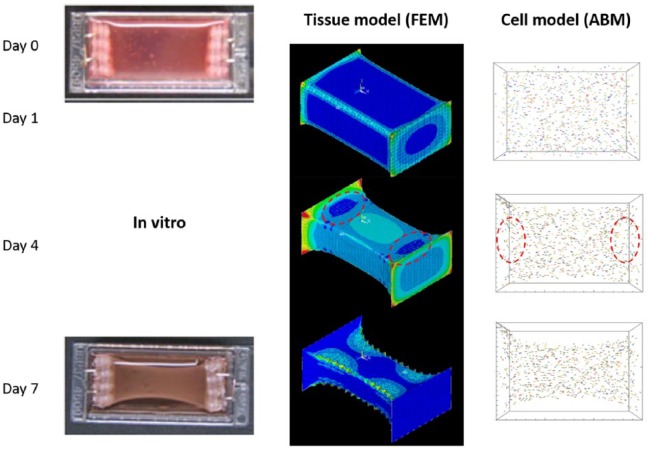
Figure 3.
In silico model results in comparison to in vitro13 construct development over 7 days. The FEM results show the magnitude of principal strain (red – high and blue – low) and the ABM results show location as well as orientation of the cells by arrows. The cells are coloured randomly, to allow easy recognition of each cell.
Source of in vitro images: Smith et al.,13 reproduced with permission of John Wiley and Sons.

