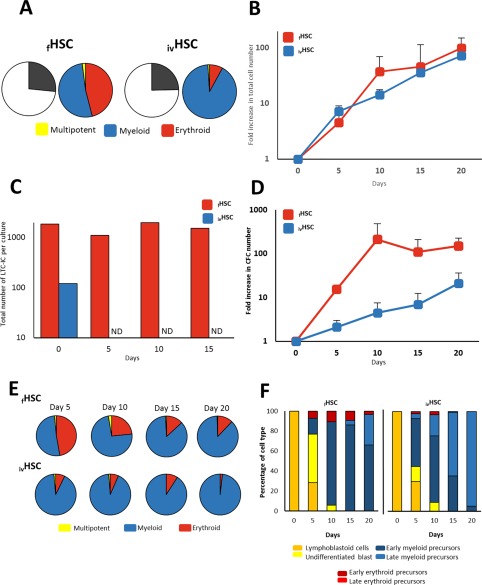
Figure 2.

In vitro functional characterization of HSCs. (A): CFC content in the cell fractions corresponding to fHSCs and ivHSCs right after they were obtained by fluorescence activated cell sorting and before culture. Graphics represent the mean frequency (%; n = 9) of myeloid, erythroid, and multipotent progenitors. (B): Proliferation kinetics of fHSCs and ivHSCs throughout liquid culture. Values (mean ± SD; n = 5) represent the increments in total nucleated cell number, as compared to day 0. (C): Kinetics of LTC‐ICs throughout liquid culture. Values (means; n = 5) represent absolute cell numbers. ND, not detected. (D): Expansion kinetics of fHSCs and ivHSCs throughout liquid culture. Values (mean ± SD; n = 5) represent the increments in CFC number, as compared to day 0. (E): Frequency of myeloid, erythroid, and multipotent progenitors (as percentage of total CFC; n = 9) throughout liquid cultures of fHSCs and ivHSCs. (F): Frequency (%; n = 3) of the different hematopoietic cell types, recognized by their morphology, generated in cultures of fHSCs and ivHSCs. Abbreviations: CFCs, colony‐forming cells; HSCs, hematopoietic stem cells; LTC‐ICs, long‐term culture initiating cells.
