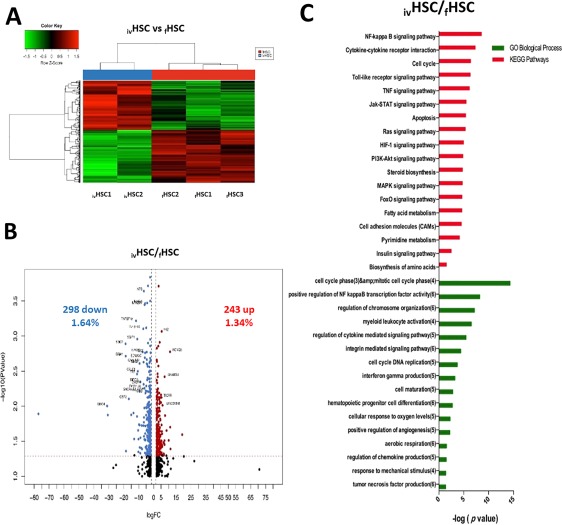
Figure 3.

Differentially expressed genes between ivHSCs and fHSCs. (A): Hierarchical cluster showing the genes differentially expressed between ivHSCs and fHSCs. Samples are in columns, genes are in rows. Both cell populations were compared using the TAC Affymetrix software, considering a fold change of 2.0 and p < .05. (B): The volcano plot shows 541 genes differentially expressed (243 genes upregulated ‐red‐ and 298 downregulated ‐blue‐ in ivHSCs). The analysis was made using TAC Affymetrix software, considering a fold change of 2.0 and p < .05. (C): Most highly represented biologic processes/pathways that were upregulated in ivHSCs as compared to fHSCs. Functional annotation in Gene Ontology categories was made using GeneTrail2, and were classified in biological processes and KEGG categories. Abbreviation: HSCs, hematopoietic stem cells.
