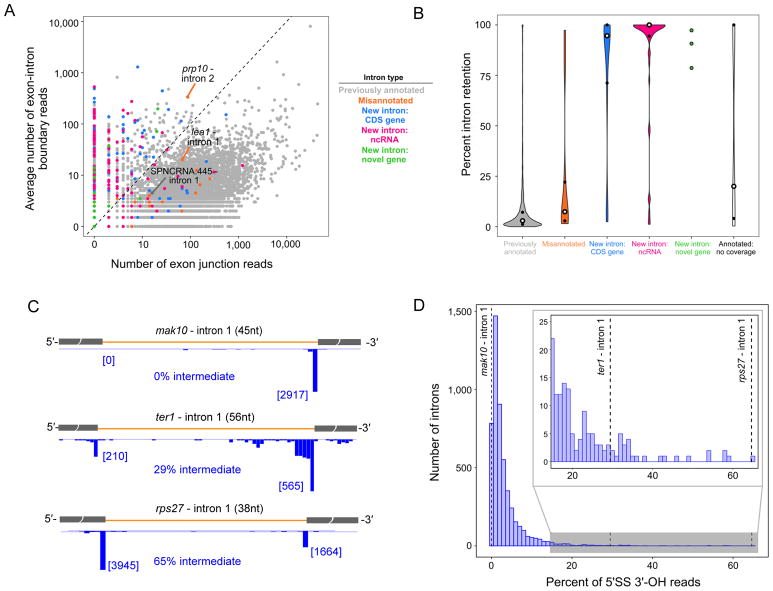
Figure 3. Retained and high splicing intermediate introns.
(A) Scatterplot of the number of exon junction reads verses number of exon-intron boundary reads from WT RNA-Seq data for all S. pombe introns colored by type as indicated. Introns previously mentioned in Figure 2 are labeled.
(B) Violin plots comparing percent of intron retention between intron groups defined in A. Previously annotated introns not covered by 5′-P or 3′-OH data are shown in white.
(C) Examples of introns with different levels of splicing intermediates. Numbers in brackets: 3′-OH 3′ read ends terminating at the 5′SS or 3′SS.
(D) Histogram of percent of splicing intermediate (calculated as fraction of 5′SS 3′-OH to all intron 3′-OH reads) across all introns with ≥ 25 3′SS 3′-OH reads in both replicates. Dashed vertical lines indicate introns shown in A.

