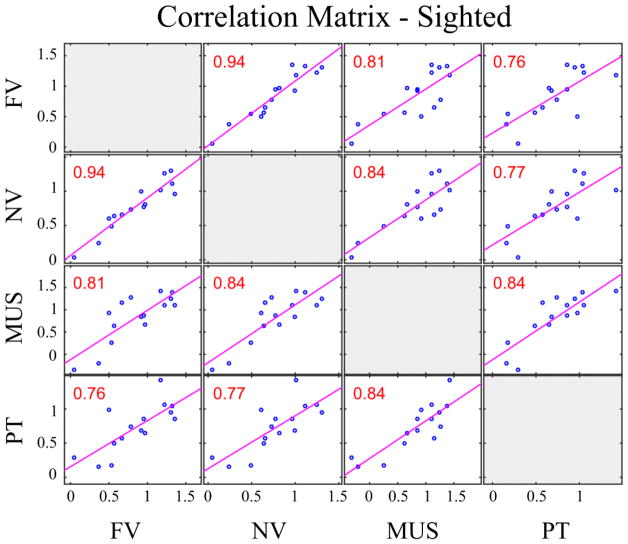
Figure 5.
Correlation matrix between FDL thresholds of sighted participants. The figure shows the correlation between the log-transformed FDLs for French vowels (FV), non-native vowels (NV), pure tones (PT) and music instruments (MUS) for sighted participants. Pearson’s linear correlation coefficients are shown for each pair; red color indicates significant correlation corrected with Bonferroni adjustment (p<0.0083).

