Figure 3.
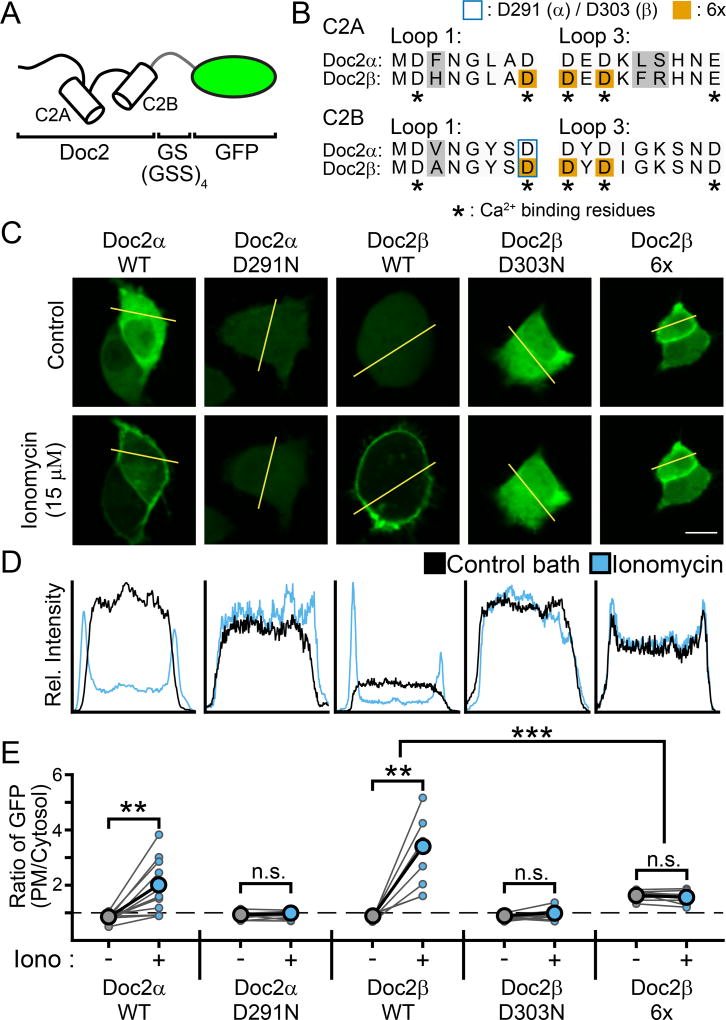
Translocation assays demonstrating that mutations in Doc2 can result in either loss-or gain-of-function. A. Doc2α and β were tagged at their C-termini with GFP for visualization of their subcellular distribution when expressed in PC12 cells. B. Sequence alignment of the Ca2+-binding loops of Doc2α and β. In C2A, loop 1 corresponds to aa 122–129 / 156–163 (α / β) and loop 3 corresponds to AA 184–192 / 218–226 (Friedrich et al., 2010). In C2B, loops 1 and 3 correspond to residues 284–291 / 296–303 and 345–353 / 357–365, respectively (Giladi et al., 2013). The loops of Doc2α were determined by sequence alignment with Doc2β. Grey backgrounds highlight differences between the isoforms. Asterisks denote residues that serve as Ca2+ ligands. Substituted residues are denoted by either a blue border (Doc2α D291, Doc2β D303) or an orange background (Doc2β 6x). C. Representative PC12 cells that were transfected with GFP-tagged WT or mutant Doc2α or β in control conditions (top) or when treated with ionomycin (bottom). Scale bar represents 10 µm. D. Line-scans of the cells in panel (C) (denoted by the yellow line) quantifying the subcellular distribution of Doc2 (as measured by GFP intensity). A single, representative line scan was performed for each cell analyzed. E. Quantification of the ratio of GFP intensity at the PM divided by the average intensity in the cytosol for each PC12 cell imaged. Connected dots represent the same cell before and after addition of ionomycin. * denotes p < 0.05, ** denotes p < 0.01, *** denotes p < 0.001, n.s. denotes p > 0.05.

