
Fig. 1. cbMg display a cell clearance phenotype.
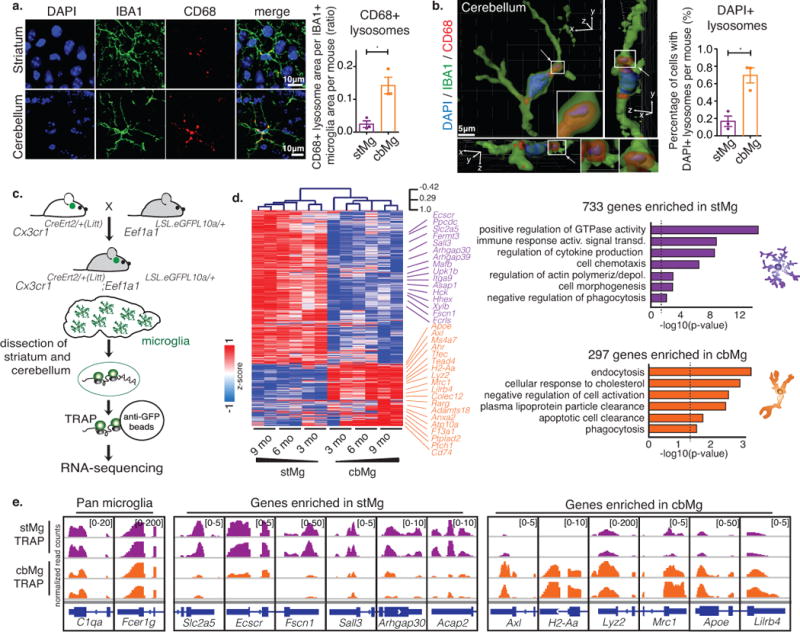
(a) CD68+ lysosome content (red) in IBA1+ microglia (green) in brain sections from 4/6mo wild-type mice (DAPI: blue). Scale: 10 μm. Representative image (left); quantification of lysosomal area/microglia area (right) are shown. stMg: mean=0.02437, SEM=0.01011; cbMg: mean=0.1424, SEM=0.02527; p=0.0166, F=6.245, t2=7.668; >15 images/region from n=3 mice. (b) DAPI content (blue) in CD68+ lysosomes (red) of IBA1+ microglia (green) was determined using 3D reconstruction (Imaris) from 4/6mo wild-type mice. Scale: 5 μm. Representative reconstruction with side scatter views (left); quantification of percentage of microglia with DAPI+ CD68+ lysosomes (right). Arrows indicate DAPI+/CD68+ lysosome, which is shown with a zoomed in view. 3D axes are shown. stMg: mean=0.1675, SEM=0.06029; cbMg: mean=0.6960, SEM=0.0868; p=0.0300, F=2.077, t2=5.639; >200 cells/region from n=3 mice. Bar graphs with individual data points show mean ± SEM, t-tests were two-tailed paired. (c) Schematic showing microglia-specific TRAP-sequencing. (d) Heatmap with hierarchical clustering distances shows the variation in the expression levels (z-scored log2 RPKM [z-score]) of 733 stMg- and 297 cbMg-enriched genes identified by TRAP (DESeq2, n=2/age/region). Selected Gene Ontology (GO) annotations (Enrichr) enriched for stMg-/cbMg-enriched genes are shown. y-axis: -log10 (p-value). Dotted lines: p=0.05. (e) Genome browser views (IGV) of normalized read counts of selected genes in stMg/cbMg by TRAP.