
Fig. 3. cbMg clearance phenotype is associated with exposure to dying cells.
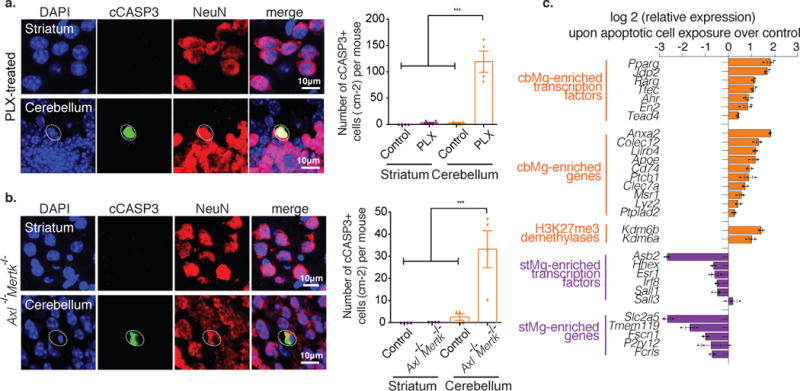
(a,b) Representative immunofluorescence images are shown (NeuN+ neurons: red; cCASP3+: green; DAPI: blue). Dotted circles: cCASP3+/NeuN+ cell. Scale: 10 μm. (a) Quantification of cCASP3+ cells per cm2 from 4mo control (striatum: mean=0, SEM=0; cerebellum: mean=2.500, SEM=1.443) or PLX-treated mice (striatum: mean=2.500, SEM=1.443; cerebellum: mean=119.2, SEM=20.02); p<0.0001, F=67.40; 14 cerebellum/striatum sections from n=4 mice/group.(b) Quantification of cCASP3+ cells per cm2 from 4/5mo control (striatum: mean=0, SEM=0; cerebellum: mean=2.500, SEM=1.443) or Axl−/−Mertk−/− mice (striatum: mean=0, SEM=0; cerebellum: mean=33.17, SEM=8.355); p=0.0003, F=14.62;12 cerebellum/striatum sections from n=4 mice/group. Bar graphs with individual data points show mean ± SEM, one-way ANOVA with Tukey’s Multiple Comparison. (c) Horizontal bar graph shows relative expression (qPCR) of selected cbMg-enriched (orange) and stMg-enriched (purple) genes in microglia after 12 hours of exposure to vehicle or early apoptotic cells. Pparg (p=0.002, t4=7.144), Jdp2 (p<0.0001, t4=15.16), Rarg (p=0.001, t4=10.16), Tfec (p<0.0001, t4=11.47); Ahr (p=0.004, t4=6.033), En2 (p=0.025, t4=3.493), Tead4 (p=0.002, t4=7.013), Anxa2 (p<0.0001, t4=36.96), Colec12 (p=0.002, t4=7.498), Lilrb4 (p<0.0001, t4=14.04), Apoe (p=0.002, t4=6.964), Cd74 (p=0.001, t4=8.070), Ptch1 (p=0.037, t4=3.066), Clec7a (p=0.015, t4=4.064), Msr1 (p=0.011, t4=4.448), Lyz2 (p=0.024, t4=3.529), Ptplad2 (p=0.009, t4=4.809), Kdm6b (p<0.0001, t4=15.33), Kdm6a (p=0.004, t4=5.871), Hhex (p=0.025, t4=3.501), Esr1 (p=0.018, t4=3.885), Irf8 (p=0.001, t4=9.580), Sall1 (p=0.139, t4=1.842), Sall3 (p=0.449, t4=0.8381), Slc2a5 (p<0.0001, t4=15.30), Asb2 (p<0.0001, t4=25.35), Tmem119 (p=0.003, t4=6.721), Fscn1 (p<0.0001, t4=18.93), P2ry12 (p=0.733, t4=0.3659), and Fcrls (p=0.001, t4=10.31). Bar graphs show mean ± SEM, two-tailed unpaired t-test, n=3 wells of primary microglia cultures obtained from four 3mo mice. Experiment was independently reproduced 4 times.