
Fig. 4. H3K27me3 is associated with suppressed clearance genes in stMg.
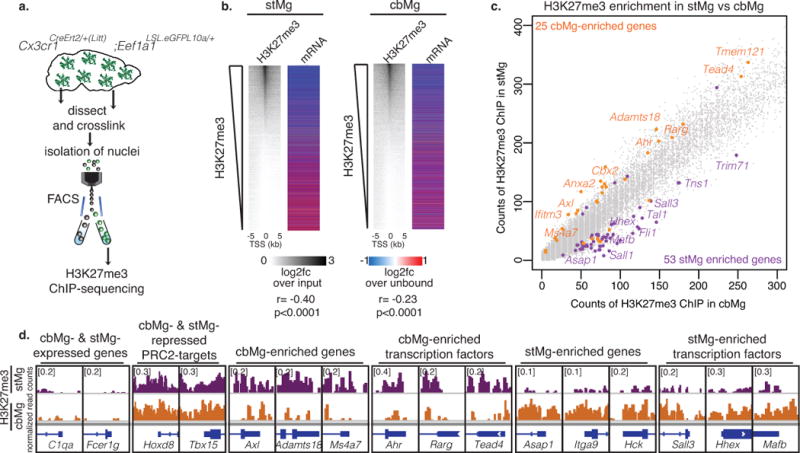
(a) Schematic showing isolation of cross-linked microglial nuclei from striatum/cerebellum for H3K27me3 ChIP-sequencing. (b) H3K27me3 enrichment at the transcriptional start site (TSS) of genes in adult stMg/cbMg is negatively correlated with stMg gene expression. Heatmaps (left) show the abundance of H3K27me3 (MACS, n=1 [25 mice]) ranked by log2 fold change (log2fc) of H3K27me3 ChIP over input in microglia nuclei at the TSS ± 5 kb of individual genes; (right) log2fc (DESeq2, n=2) of mRNAs from microglia-TRAP over their unbound fraction. stMg: p < 2.2e-16, r=-0.4002547; cbMg: p < 2.2e-16, r=-0.2161471; Pearson correlation. (c) H3K27me3 is differentially enriched at the TSS of genes in cbMg vs stMg. Scatter plot shows counts of H3K27me3 spanning the TSS ± 1kb for each gene in cbMg (x-axis) vs stMg (y-axis). cbMg- (orange) and stMg-enriched (purple) genes that are differentially enriched in H3K27me3 (MACS) in stMg and cbMg are depicted. (d) Genome browser views (IGV) of selected genes show normalized counts of H3K27me3+ chromatin at the TSS ± 1kb of the indicated genes in stMg/cbMg.