
Fig. 6. Eed deficiency in stMg induces cbMg-like clearance phenotype.
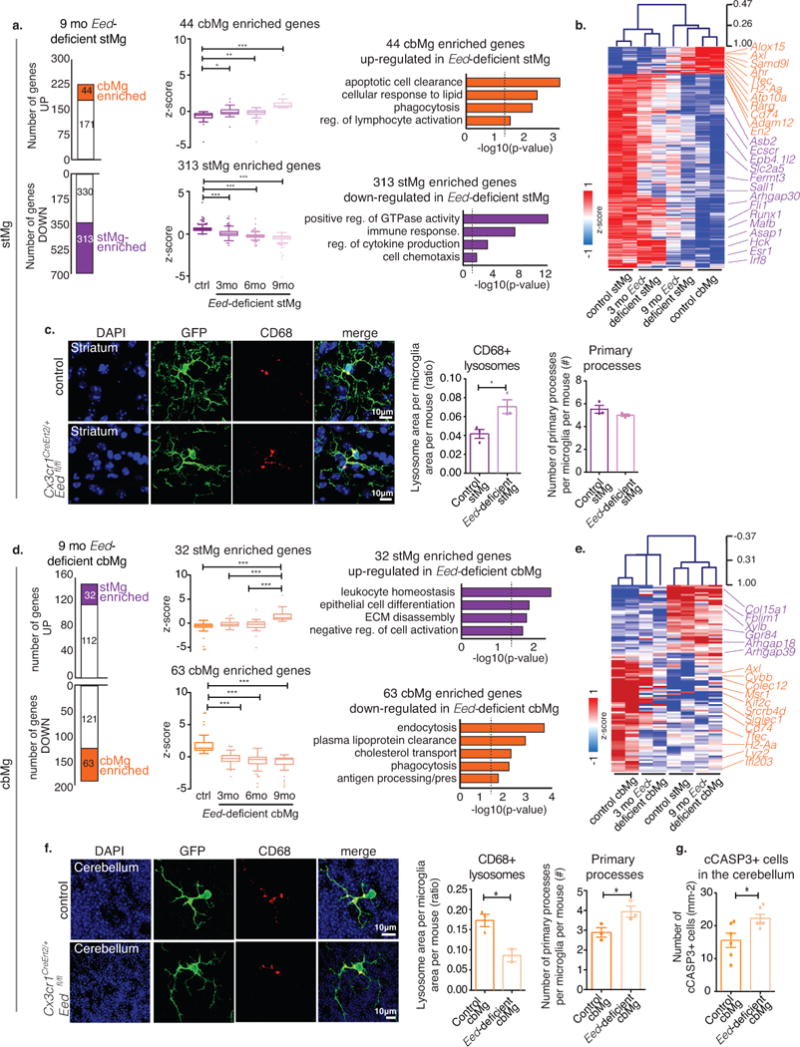
(a,d) Left: Bar graphs show number of genes up-/down-regulated in 9mo Eed-deficient stMg (a) or cbMg (d) by TRAP (DESeq2, n=2/region/genotype/age). The number of dysregulated cbMg/stMg signature genes is indicated. Middle: Box-and-whisker plots show mean relative expression of the indicated dysregulated cbMg/stMg signature genes. One-way ANOVA (Kruskal-Wallis test) with Dunn’s Multiple Comparison. Right: Selected GO annotations (Enrichr) enriched for dysregulated cbMg/stMg signature genes. y-axis: -log10 (p-value). Dotted lines: p-value=0.05. (a) 44 cbMg signature genes that are up- (ctrl: min=-4.20, 25%=-0.88, median=-0.51, 75%=-0.30, max=-0.044; 3mo: min=-2.14, 25%=-0.35, median=-0.15, 75%=0.20, max=1.73; 6mo: min=-4.20, 25%=-0.38, median=-0.11, 75%=0.09, max=0.51; 9mo: min=0.46, 25%=0.59, median=0.77, 75%= 1.15, max= 6.68; p<0.0001, F=40.99, Kruskal-Wallis statistic=106.3) and 313 stMg signature genes that are down-regulated in Eed-deficient stMg (ctrl: min=-0.03, 25%=0.44, median=0.58, 75%=0.73, max=3.77; 3mo: min=-1.37, 25%=-0.15, median=0.056, 75%=0.31, max=2.13; 6mo: min=-1.417, 25%=-0.36, median=-0.22, 75%=-0.105, max=1.84; 9mo: min=-5.639, 25%=-0.58, median=-0.39, 75%=-0.26, max= 0.22;p < 0.0001, F=487.6, KWS=820.2). (d) 32 stMg signature genes up-regulated in 9mo Eed-deficient cbMg (ctrl: min=-5.50, 25%=-0.85, median=-0.52, 75%=-0.21, max=0.60; 3mo: min=-1.36, 25%=-0.57, median=-0.28, 75%=0.16, max=1.72 ; 6mo: min=-5.08, 25%=-0.891, median=-0.24, 75%=0.24, max=2.81; 9mo: min=0.39, 25%=0.84, median=1.137, 75%=1.895, max=5.77;p < 0.0001, F=26.62, KWS=64.91) and of 63 cbMg signature genes down-regulated in 9mo Eed-deficient cbMg (ctrl: min=0.517, 25%=1.03, median=1.35, 75%=2.23, max=6.84; 3mo: min=-3.075, 25%=-0.69, median=-0.24, 75%=0.20, max=1.68; 6mo: min=-4.696, 25%=-1.065, median=-0.40, 75%=-0.07, max=1.33; 9mo: min=-4.70, 25%=-1.17, median=-0.38, 75%=-0.199, max=0.33; p < 0.0001, F=79.43, KWS=135.7). (b,e) Heatmap with hierarchical clustering distances shows the variation in the expression levels (z-score) of cbMg/stMg signature genes that are dysregulated in 3 & 9mo Eed-deficient stMg (b) or cbMg (e) with control stMg and cbMg. (c,f) CD68+ lysosome content (red) in YFP+ microglia (green) from 12-month-old control, Cx3cr1CreErt2/+;Eedfl/+, and mutant, Cx3cr1CreErt2/+;Eedfl/fl, mice (DAPI: blue). Scale: 10 μm. Representative image (left); quantification of the lysosomal area/microglia area and number of primary processes (right). (c) Lysosomal content: Control: mean= 0.04169, SEM=0.004789; mutant: mean= 0.07056, SEM= 0.007284; p=0.0296, F=2.313, t4=3.312; 18 images from n=3/genotype. Number of primary processes (control: mean=5.514, SEM=0.3433; mutant: mean=4.989, SEM=0.1060; p=0.2174, F=10.49, t4=1.462) 20-25 cells from n=3 mice/genotype. (f) Lysosome area: Control: mean=0.1728, SEM=0.01556); mutant: mean=0.08600, SEM=0.01564; p=0.0334, F=1.485, t3=3.739 (16 images from n=3/genotype). Number of primary processes: Control: mean=2.889, SEM=0.2422; mutant: mean=3.940, SEM=0.2845; p=0.0481, F=1.380, t4=2.815. 20-25 cells from n=3 mice/genotype. (g) Quantification of cCASP3+ cells in the cerebellum. Control: mean=15.56, SEM=2.169; mutant: mean=22.25, SEM=1.239; p=0.0316, F=3.064, t7=2.679. 5-8 images from n=6 mice/genotype. Two-tailed unpaired t-test unless otherwise specified. Bar graph with individual data points shows mean ± SEM. *p ≤ 0.05, **p ≤ 0.01, ***p ≤ 0.001.