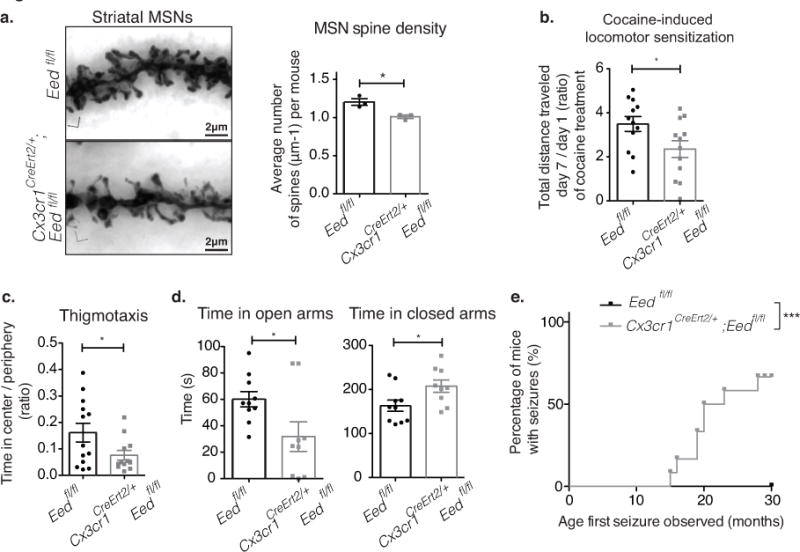
Fig. 7. Microglia-specific Eed deficiency alters MSN morphology and MSN-controlled behaviors in mice.

(a) Representative images of Golgi-stained neuronal processes of MSNs from 15-month-old control, Eedfl/fl, and Cx3cr1CreErt2/+;Eedfl/fl mice. Scale: 2 μm. Bar graph with individual data points shows total spine densities of MSNs of control (mean=1.205, SEM=0.04387) and mutant mice (mean= 1.009, SEM= 0.02326). p=0.0171, F=3.556, t4=3.932; 30 dendrites from n=3 mice/genotype. (b) Bar graph with individual data points shows the ratio of total distance traveled on day 7 versus day 1 of daily cocaine administration (control: mean=3.497, SEM=0.3380; mutant: mean= 2.356, SEM= 0.3833) p=0.0361, F=1.286, t22=2.232; n=12/genotype. (c) Open field analysis (thigmotaxis) shows mutant mice spend less time in the center vs periphery (mean=0.2138, SEM=0.03855) than control mice (mean=0.2714, SEM=0.03522) p=0.0459, F=4.110, t23=2.110, n=13/genotype. (d) Elevated plus maze analysis shows that mutant mice spend less time in the open arms (mean=60.09, SEM=5.765) than control mice (mean=31.77, SEM= 11.23) p=0.0279, F=3.415, MWU=18.00, SWp=0.0210; and more time in closed arms (mutant: mean=163.0, SEM=12.75; control: mean=207.5, SEM=14.09) p=0.0314, F=1.100, t17=2.346, n=10/genotype. Grubbs’ Test was used to identify and exclude an outlier. (e) Mutant mice develop seizures with age. Kaplan-Meier curve (n=12 mutant, 14 control mice; p=0.0002; χ2=13.71 log-rank Mantel–Cox test). Bar graphs with individual data points show mean ± SEM. All t-tests were two-tailed unpaired.
