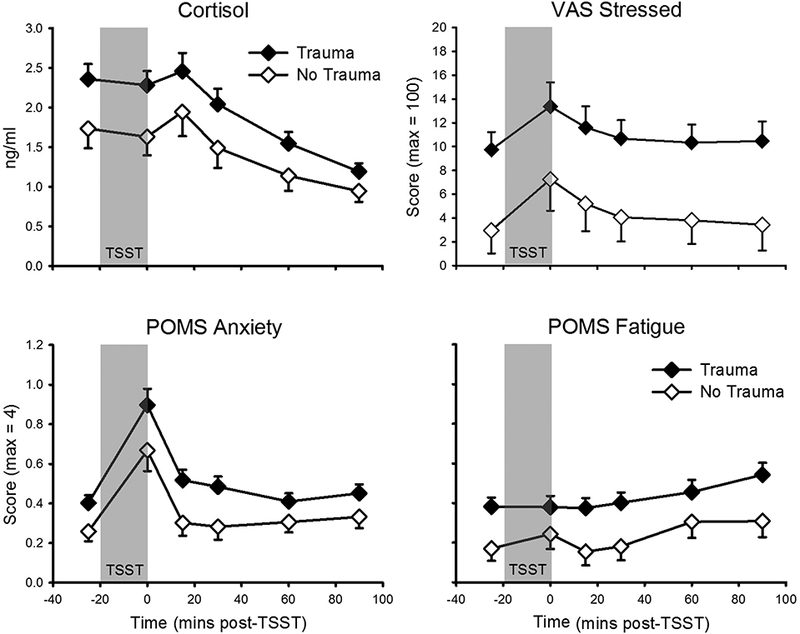
Figure 2.

TSST responses as a function of trauma. Top Left: Salivary cortisol (no trauma: n = 35; trauma: n = 61). Top Right: Visual Analogue Scale (VAS) ‘stress’ (no trauma: n = 35; trauma: n = 60). Bottom Left: Profile of Mood States (POMS) ‘anxiety’ (no trauma: n = 38; trauma: n = 61). Bottom Right: POMS ‘fatigue’; (no trauma: n = 37; trauma: n = 67). TSST (introduction + speech + mental arithmetic) appears as gray-filled region. Data presented are means and standard errors. There were main effects of trauma group on all four variables presented, with no differential stress responding.
