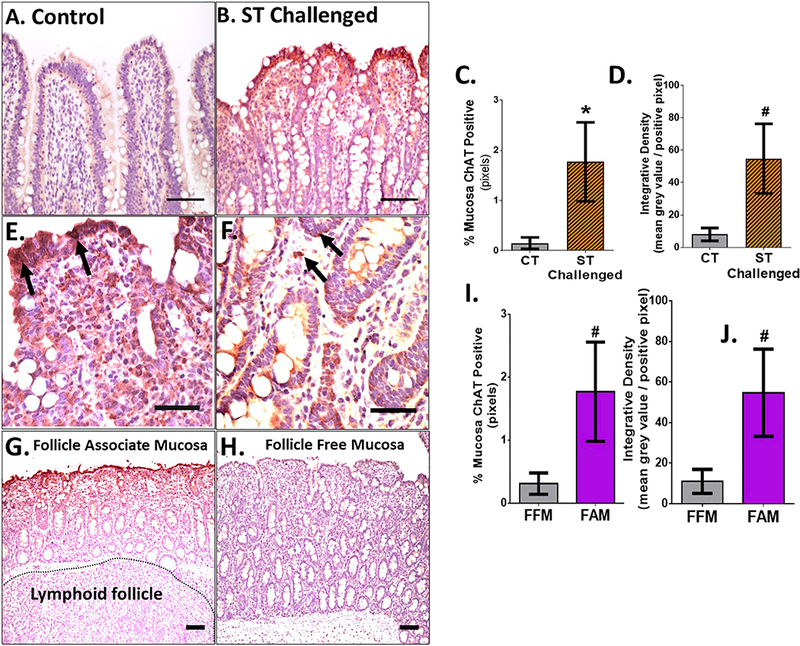
Figure 2. ChAT is elevated in epithelium and round cells of lamina propria over the Peyer’s patch following S. Typhimurium challenge.

A-B: 20x images of control (A) and ST challenged (B), scale bar = 100uM. C-D: % of area of ChAT positive mucosa (C) and integrated pixel density analysis (D) between control and ST challenged pigs. E,F: 40x representative images from ileum from an S. Typhimurium challenged animal demonstrating the enhanced epithelial expression (arrows) and staining within lamina propria monocytes (E,F; arrows). G-J: 10x image of (G) follicle free mucosa (FAM) and (H) follicle associated mucosa (FAM) . In (G), note the Peyer’s patch lymphoid follicle tissue directly under the mucosa. I,J: % area ChAT positive and integrated density between (I) FFM and (J) FAM .Scale bar - 100um. CT = Control, ST = S. Typhimurium. Mann-Whitney t-test was used in (C) and (G). Students T-test used in (D) and (H). # p<0.1, * p<0.05.
