
Figure 2.
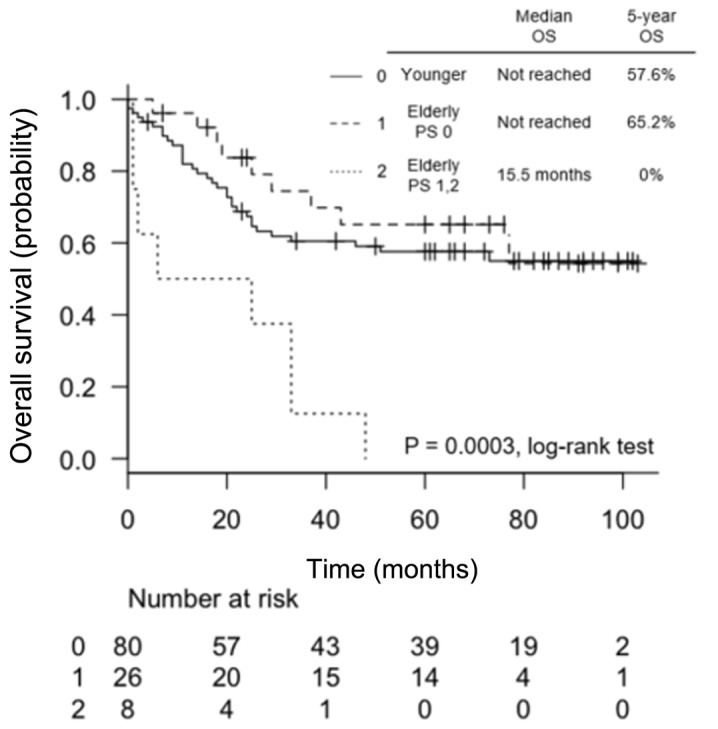
Kaplan-Meier curves of overall survival (OS) for elderly patients according to performance status (PS) compared with younger patients (0: <65 years, 1: ≥65 years with PS 0 and 2: ≥65 years with PS 1 and 2).
Official websites use .gov
A
.gov website belongs to an official
government organization in the United States.
Secure .gov websites use HTTPS
A lock (
) or https:// means you've safely
connected to the .gov website. Share sensitive
information only on official, secure websites.
Kaplan-Meier curves of overall survival (OS) for elderly patients according to performance status (PS) compared with younger patients (0: <65 years, 1: ≥65 years with PS 0 and 2: ≥65 years with PS 1 and 2).