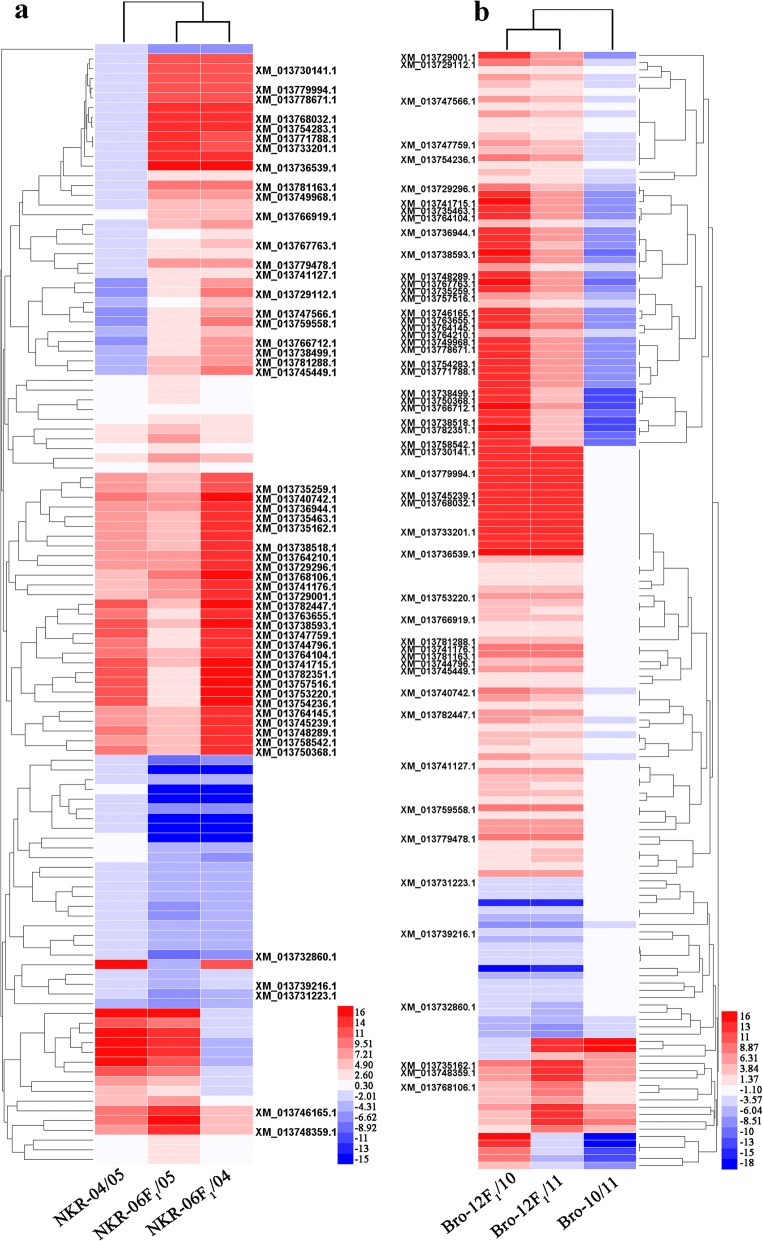
Fig. 3.
Hierarchical cluster analysis of representative DEGs in two broccoli hybrid combinations. a indicated the expression profiles of representative DEGs in the NKR-04/− 05/− 06 hybrid triad. b indicated the expression profiles of representative DEGs in the Bro-10/− 11/− 12 hybrid triad. The expression levels of these DEGs in the hybrid were significantly different from those in both parents. The accession numbers of DEGs which shared in both hybrid triads were visual. The heat maps were constructed based on the log2 (fold-change of the normalized expression levels) of two arbitrary samples in each hybrid triad. The color scale represents the log2 (fold-change of the normalized expression levels) of two arbitrary samples with blue denoting low expression and red denoting high expression

